Figures & data
Table I. Genome-wide gene expression analysis of genes related to bone formation in arterial plaques relative to non-atherosclerotic internal thoracic artery control samples in Tampere Vascular Study.
Figure 1. CA2 and CA12 expression in control internal thoracic artery (ITA), carotid, femoral, and aortic plaque samples. Gene expression value is the normalized average gene intensity for each group measured in the Illumina Expression BeadChips. *P < 0.05, **P < 0.01, ***P < 0.001 relative to control (ITA), Mann-Whitney U-test.
Table II. Genome-wide gene expression analysis of carbonic anhydrases in arterial plaques relative to non-atherosclerotic internal thoracic artery control samples in Tampere Vascular Study.
Figure 2. CA2 and CA12 expression in atherosclerotic plaque and control internal thoracic artery (ITA) samples measured with TaqMan Low-Density Array (LDA). *P < 0.05, **P < 0.01, ***P < 0.001 relative to control (ITA), Mann-Whitney U-test.
Figure 3. Expression of CA2 and CA12 in control internal thoracic artery (ITA), carotid, aortic, and femoral plaque samples measured with TaqMan Low-Density Array (LDA). *P < 0.05, **P < 0.01, ***P < 0.001 relative to control (ITA), Mann-Whitney U-test.
Figure 4. Expression of CAII and CAXII proteins in human atherosclerotic plaques in human aortic (A), femoral (B), and carotid (C) plaques. Samples from internal thoracic artery served as controls (D). Arrows indicate typical positively stained cells. The stage of atherosclerosis was classified according to American Heart Association (AHA) classification (type I–VI). 100× magnification.
Figure 5. Double immunofluorescence and mirror image section images demonstrating co-localization of CAII and CAXII proteins with CD68 in human atherosclerotic plaques in representative carotid plaques. CAII labeling is cytosolic while CAXII labeling is strong in the cell membrane.
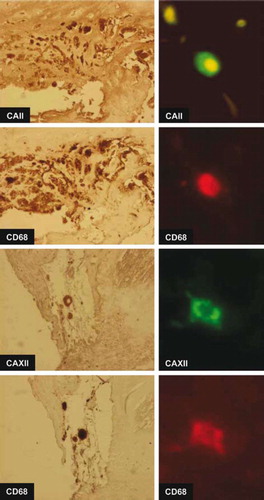
Figure 6. Mirror image section images demonstrating co-localization of CAXII protein with TRAP in human atherosclerotic plaques in representative carotid plaques. Corresponding cells, cell clusters, and microanatomic structures are indicated by an arrow-head, numbers 1–4, stars, and an asterisk.