Figures & data
Table I. Characteristics of the study group at the time of the initial episode of licorice-induced hypertension and during the present study. All laboratory values at the time of licorice-induced hypertension are based on the availability of previous medical records. Values are mean ± SEM.
Table II. Characteristics of the subjects with α-, β-, or γENaC gene variants during the present study. Current licorice consumption could not be excluded for subjects 1 and 6.
Figure 1. Partial amino acid sequence of the wild-type αENaC (αENaC wt) and predicted amino acid sequence corresponding to the αENaC G insertion mutation. The mutation affects the carboxy-terminal codon (corresponding to proline residue 669) predicted to result in insertion of 61 amino acids (underlined). Only sequences corresponding to the carboxy-terminal parts (starting from the PPPXY motif, indicated by a box) are shown. In silico prediction revealed a putative protein kinase C phosphorylation site (asterisk), a putative casein kinase II phosphorylation site (square), and a cysteine predicted to form a disulfide bond (triangle).
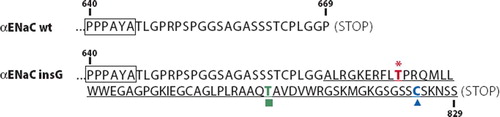
Figure 2. The pedigrees of the two families with the αENaC G insertion mutation. The probands are shown by arrow (the probands of Families I and II are the Subjects 1 and 2 of , respectively). The ages are given as recorded at the time of the present study (ht+ = treatment-requiring hypertension; ht− = no hypertension; ht(+) = elevated blood pressure without antihypertensive treatment; ? = blood pressure status unknown; ND = not determined; Ren = plasma renin, μg/L/h; Aldo = serum aldosterone, pmol/L; K = potassium, mmol/L).