745
Views
41
CrossRef citations to date
0
Altmetric
Research Articles

Complement activation in Puumala hantavirus infection correlates with disease severity

, , , , , , , & show all
Pages 468-475 | Received 18 Nov 2010, Accepted 09 Feb 2011, Published online: 15 Apr 2011

Figures & data

Figure 1. A: Paired plasma levels of SC5b-9 of PUUV-HFRS patients during the acute stage upon admission to hospital and at full recovery. The median maximum SC5b-9 concentration in the acute stage was 493 ng/mL (range 103–1034 ng/mL), and the level at full recovery was 197 ng/mL (range 100–522 ng/mL). B: Paired plasma levels of C3 of PUUV-HFRS patients during the acute stage and at full recovery. The median minimum C3 concentration in the acute stage was 1.26 g/L (range 0.65–2.24 g/L), and the level at full recovery was 1.47 g/L (range 0.84–2.44 g/L). C: Paired plasma levels of C4 of PUUV-HFRS patients during the acute stage and at full recovery. The median minimum C4 concentration in the acute stage was 0.26 g/L (range 0.08–0.52 g/L), and the level at full recovery was 0.27 g/L (range 0.09–1.1 g/L). Wilcoxon's test was used to determine the statistical significance in A, B, and C.

Figure 1. A: Paired plasma levels of SC5b-9 of PUUV-HFRS patients during the acute stage upon admission to hospital and at full recovery. The median maximum SC5b-9 concentration in the acute stage was 493 ng/mL (range 103–1034 ng/mL), and the level at full recovery was 197 ng/mL (range 100–522 ng/mL). B: Paired plasma levels of C3 of PUUV-HFRS patients during the acute stage and at full recovery. The median minimum C3 concentration in the acute stage was 1.26 g/L (range 0.65–2.24 g/L), and the level at full recovery was 1.47 g/L (range 0.84–2.44 g/L). C: Paired plasma levels of C4 of PUUV-HFRS patients during the acute stage and at full recovery. The median minimum C4 concentration in the acute stage was 0.26 g/L (range 0.08–0.52 g/L), and the level at full recovery was 0.27 g/L (range 0.09–1.1 g/L). Wilcoxon's test was used to determine the statistical significance in A, B, and C.

Figure 2. A: Box plots of plasma SC5b-9 levels of patients with and without chest X-ray abnormalities in the acute stage of PUUV-HFRS and at full recovery. Box plot illustrates the median value (center horizontal line), interquartile range (the lower and upper quartiles), and the highest and lowest values (whiskers) that are not outliers. The outliers are presented as circles. The median maximum SC5b-9 levels in patients with and without chest X-ray abnormalities in the acute stage were 637 ng/mL (range 334–1034 ng/mL) and 464 ng/mL (range 103–977 ng/mL) and at full recovery 222 ng/mL (range 123–365) and 203 ng/mL (100–522 ng/mL), respectively. B: Box plots of plasma C3 levels of patients with and without chest X-ray abnormalities in the acute stage of PUUV-HFRS patients and at full recovery. Box plot illustrates the median value (center horizontal line), interquartile range (the lower and upper quartiles), and the highest and lowest values (whiskers) that are not outliers. The outliers are presented as circles (minor outlier) or asterisks (major outlier). The median minimum C3 levels in patients with and without chest X-ray abnormalities in the acute stage were 1.1 g/L (range 0.65–1.64) and 1.26 g/L (range 0.7–2.24) and at full recovery 1.46 g/L (range 1.2–1.94) and 1.41 (range 0.84–2-44), respectively. C: Box plots of plasma C4 levels of patients with and without chest X-ray abnormalities in the acute stage of PUUV-HFRS and at full recovery. Box plot illustrates the median value (center horizontal line), interquartile range (the lower and upper quartiles), and the highest and lowest values (whiskers) that are not outliers. The outliers are presented as circles. The median minimum C4 levels in patients with and without chest X-ray abnormalities in the acute stage were 0.24 g/L (range 0.12–0.42 g/L) and 0.25 g/L (range 0.08–0.43 g/L) and at full recovery 0.23 g/L (range 0.13–1.06 g/L) and 0.28 g/L (range 0.09–1.10), respectively. Mann–Whitney test was used to determine statistical significance in A, B, and C.

Figure 2. A: Box plots of plasma SC5b-9 levels of patients with and without chest X-ray abnormalities in the acute stage of PUUV-HFRS and at full recovery. Box plot illustrates the median value (center horizontal line), interquartile range (the lower and upper quartiles), and the highest and lowest values (whiskers) that are not outliers. The outliers are presented as circles. The median maximum SC5b-9 levels in patients with and without chest X-ray abnormalities in the acute stage were 637 ng/mL (range 334–1034 ng/mL) and 464 ng/mL (range 103–977 ng/mL) and at full recovery 222 ng/mL (range 123–365) and 203 ng/mL (100–522 ng/mL), respectively. B: Box plots of plasma C3 levels of patients with and without chest X-ray abnormalities in the acute stage of PUUV-HFRS patients and at full recovery. Box plot illustrates the median value (center horizontal line), interquartile range (the lower and upper quartiles), and the highest and lowest values (whiskers) that are not outliers. The outliers are presented as circles (minor outlier) or asterisks (major outlier). The median minimum C3 levels in patients with and without chest X-ray abnormalities in the acute stage were 1.1 g/L (range 0.65–1.64) and 1.26 g/L (range 0.7–2.24) and at full recovery 1.46 g/L (range 1.2–1.94) and 1.41 (range 0.84–2-44), respectively. C: Box plots of plasma C4 levels of patients with and without chest X-ray abnormalities in the acute stage of PUUV-HFRS and at full recovery. Box plot illustrates the median value (center horizontal line), interquartile range (the lower and upper quartiles), and the highest and lowest values (whiskers) that are not outliers. The outliers are presented as circles. The median minimum C4 levels in patients with and without chest X-ray abnormalities in the acute stage were 0.24 g/L (range 0.12–0.42 g/L) and 0.25 g/L (range 0.08–0.43 g/L) and at full recovery 0.23 g/L (range 0.13–1.06 g/L) and 0.28 g/L (range 0.09–1.10), respectively. Mann–Whitney test was used to determine statistical significance in A, B, and C.

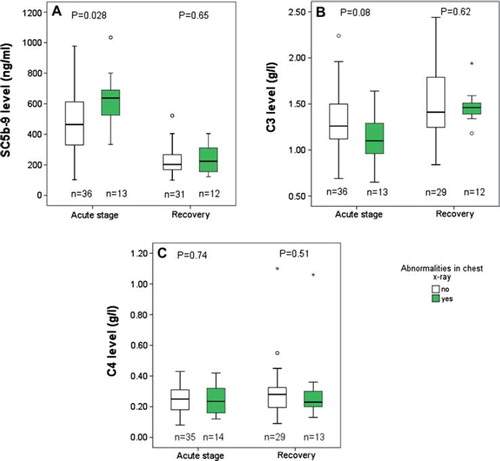
Table I. Clinical and laboratory findings in 61 patients with acute PUUV-HFRS.

Table II. Spearman rank correlations of minimum acute-stage level of C3 and C4 and maximum acute-stage level of SC5b-9 with clinical and laboratory findings in PUUV-HFRS patients.

Reprints and Corporate Permissions

Please note: Selecting permissions does not provide access to the full text of the article, please see our help page How do I view content?

To request a reprint or corporate permissions for this article, please click on the relevant link below:

Academic Permissions

Please note: Selecting permissions does not provide access to the full text of the article, please see our help page How do I view content?

Obtain permissions instantly via Rightslink by clicking on the button below:

If you are unable to obtain permissions via Rightslink, please complete and submit this Permissions form. For more information, please visit our Permissions help page.