363
Views
5
CrossRef citations to date
0
Altmetric
Research Articles

Arterial elasticity and oxidized LDL among men with metabolic syndrome and different 10-year cardiovascular risk estimated by FINRISK and SCORE models

, , , , , & show all
Pages 503-512 | Received 26 Nov 2010, Accepted 19 May 2011, Published online: 04 Jul 2011

Figures & data

Figure 1. Large (C1) and small (C2) arterial elasticity among low-, medium-, and high-risk subjects according to FINRISK (A) and SCORE (B) models at the actual age. A: C1 was 18.5 ± 3.2 mL/mmHg × 10 among low-risk (<5%; n = 26), 16.4±4.1 mL/ mmHg × 10 among medium-risk (5%–14.99%; n = 36), and 14.8±4.5 mL/mmHg × 10 among high-risk (≥ 15%; n =17) subjects according to FINRISK at the actual age. C2 was 10.1 ±3.6 mL/mmHg × 100, 6.7±3.0 mL/mmHg × 100, and 4.9±2.0 mL/mmHg × 100, respectively. B: C1 was 17.6±3.6 mL/mmHg × 10 among low-risk (<3%; n = 44), 17.2±4.1 mL/ mmHg × 10 among medium-risk (3%–4.99%; n = 20), and 13.6±4.4 mL/mmHg × 10 among high-risk (>5%; n = 15) subjects according to SCORE at the actual age. C2 was 8.4 ± 3.7 mL/mmHg × 100, 7.3 ±3.4 mL/mmHg × 100, and 4.6 ± 2.1 mL/ mmHg × 100, respectively.
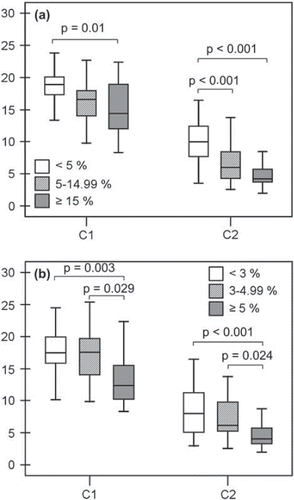
Figure 1. Large (C1) and small (C2) arterial elasticity among low-, medium-, and high-risk subjects according to FINRISK (A) and SCORE (B) models at the actual age. A: C1 was 18.5 ± 3.2 mL/mmHg × 10 among low-risk (<5%; n = 26), 16.4±4.1 mL/ mmHg × 10 among medium-risk (5%–14.99%; n = 36), and 14.8±4.5 mL/mmHg × 10 among high-risk (≥ 15%; n =17) subjects according to FINRISK at the actual age. C2 was 10.1 ±3.6 mL/mmHg × 100, 6.7±3.0 mL/mmHg × 100, and 4.9±2.0 mL/mmHg × 100, respectively. B: C1 was 17.6±3.6 mL/mmHg × 10 among low-risk (<3%; n = 44), 17.2±4.1 mL/ mmHg × 10 among medium-risk (3%–4.99%; n = 20), and 13.6±4.4 mL/mmHg × 10 among high-risk (>5%; n = 15) subjects according to SCORE at the actual age. C2 was 8.4 ± 3.7 mL/mmHg × 100, 7.3 ±3.4 mL/mmHg × 100, and 4.6 ± 2.1 mL/ mmHg × 100, respectively.

Table I. Demographics of the subjects with medium (5%–14.99%) or high (≥ 15%) 10-year cardiovascular risk according to the FINRISK model at the projected age of 60.

Figure 2. Large (C1) and small (C2) arterial elasticity (A) and oxidized LDL (oxLDL) (B) among medium- and high-risk subjects according to the FINRISK model at the projected age of 60. C1 was 18.9 ±3.3 mL/mmHg × 10 among medium-risk (5%–14.99%; n = 35) and 15.1 ± 4.0 mL/mmHg × 10 among high-risk (≥ 15%; n = 44) subjects. C2 was 8.6 ±3.6 mL/mmHg × 100 and 6.5 ± 3.4 mL/mmHg × 100, respectively. OxLDL was 70.7 ± 38.1 U/L among medium-risk and 94.8 ± 32.1 U/L among high-risk subjects.
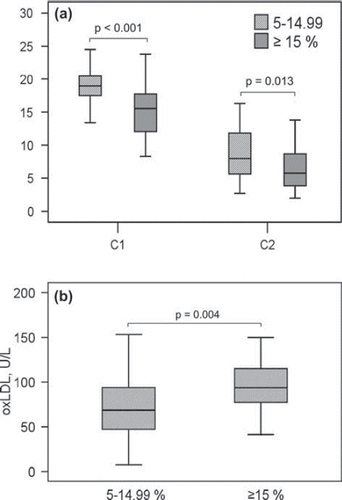
Figure 2. Large (C1) and small (C2) arterial elasticity (A) and oxidized LDL (oxLDL) (B) among medium- and high-risk subjects according to the FINRISK model at the projected age of 60. C1 was 18.9 ±3.3 mL/mmHg × 10 among medium-risk (5%–14.99%; n = 35) and 15.1 ± 4.0 mL/mmHg × 10 among high-risk (≥ 15%; n = 44) subjects. C2 was 8.6 ±3.6 mL/mmHg × 100 and 6.5 ± 3.4 mL/mmHg × 100, respectively. OxLDL was 70.7 ± 38.1 U/L among medium-risk and 94.8 ± 32.1 U/L among high-risk subjects.

Figure 3. Large (C1) and small (C2) arterial elasticity (A) and oxidized LDL (oxLDL) (B) among medium- and high-risk subjects according to the SCORE model at the projected age of 60. C1 was 20.0±3.0 mL/mmHg×10 among medium-risk (3%–4.99%; n = 19) and 15.7 ±3.9 mL/mmHg × 10 among high-risk (>5%; n = 60) subjects. C2 was 7.6±3.4 mL/mmHg × 100 and 7.3±3.7 mL/mmHg × 100, respectively. OxLDL was 70.1 ± 35.8 U/L among medium-risk and 88.8 ± 36.0 U/L among high-risk subjects.
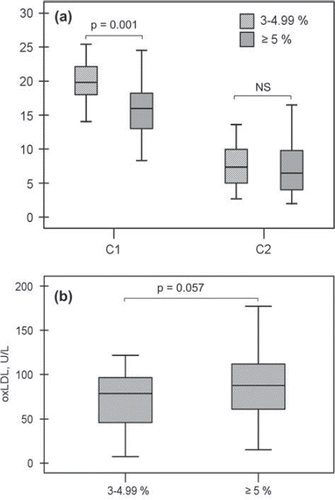
Figure 3. Large (C1) and small (C2) arterial elasticity (A) and oxidized LDL (oxLDL) (B) among medium- and high-risk subjects according to the SCORE model at the projected age of 60. C1 was 20.0±3.0 mL/mmHg×10 among medium-risk (3%–4.99%; n = 19) and 15.7 ±3.9 mL/mmHg × 10 among high-risk (>5%; n = 60) subjects. C2 was 7.6±3.4 mL/mmHg × 100 and 7.3±3.7 mL/mmHg × 100, respectively. OxLDL was 70.1 ± 35.8 U/L among medium-risk and 88.8 ± 36.0 U/L among high-risk subjects.

Table II. Cardiovascular risk factors included in the multivariate analyses of circulating levels of oxidized LDL and arterial elasticity (n = 120).

Table III. Final models of the multivariate analyses of oxidized LDL (oxLDL) as well as large (C1) and small (C2) arterial elasticity. The β values of significant covariates as well as adjusted R2 and P values of the models are presented.

Reprints and Corporate Permissions

Please note: Selecting permissions does not provide access to the full text of the article, please see our help page How do I view content?

To request a reprint or corporate permissions for this article, please click on the relevant link below:

Academic Permissions

Please note: Selecting permissions does not provide access to the full text of the article, please see our help page How do I view content?

Obtain permissions instantly via Rightslink by clicking on the button below:

If you are unable to obtain permissions via Rightslink, please complete and submit this Permissions form. For more information, please visit our Permissions help page.