Figures & data
Table I. Clinical characteristics of the study subjects.
Figure 1. Self-organizing map (SOM) component planes of alcohol consumption, plasma adiponectin concentration, variables related to lipoprotein metabolism and to the metabolic syndrome and its components (details in Subjects and methods, Analysis of plasma lipid and lipoprotein concentrations and determination of the metabolic syndrome). Colorings from reddish through white to bluish denote whether the value of the variable is above (red) or below (blue) the average level of the variable (white). The maps were organized according to plasma concentrations of lipoprotein lipids and the composition of lipoprotein particles (for details see Subjects and methods, Self-organizing map analysis). The numbers in the hexagonal units of the SOM planes denote the mean value of the variable in this particular unit. (CETP = plasma cholesteryl ester transfer protein; C = cholesterol; TG = triglycerides; VLDL, IDL, LDL, and HDL = very-low-, intermediate-, low-, and high-density lipoproteins, respectively; BMI = body mass index; MetS = the metabolic syndrome; BP = blood pressure).
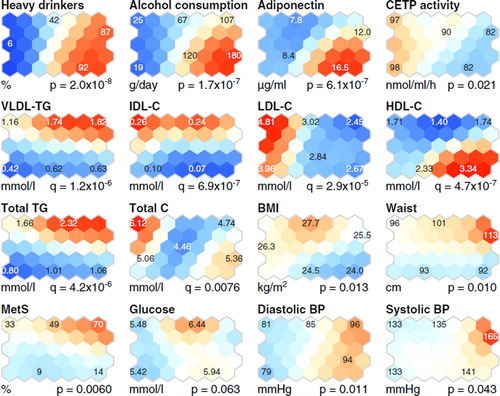
Figure 2. Self-organizing map (SOM) component planes of the in-silico characterization of lipoprotein particles (Citation11). Four lipid concentration measures per lipoprotein fraction were determined, namely triglycerides (TG), phospholipids (PL), free cholesterol (FC), and cholesterolesters (CE), and the corresponding compositional measures (marked with an asterisk) were calculated by scaling the concentration measures with the measured total protein amount in each fraction. Also estimated particle diameters are shown (Citation21). Allother details are as given in the caption for .
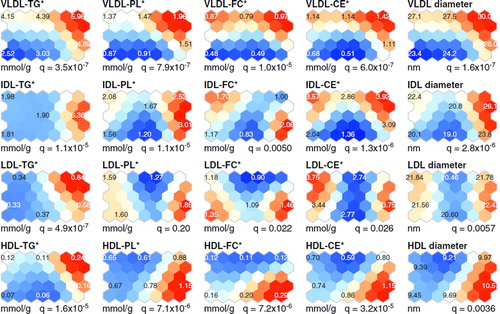
Figure 3. Selected clinical characteristics of the study subjects in the self-organizing map (SOM) analysis. (CDT = percentage of carbohydrate-deficient transferrin from total transferrin; ALT = alanine aminotransferase activity; ALP = alkaline phosphatase activity; AST = aspartate aminotransferase activity; GT = γ-glutamyltransferase activity; hsCRP = high-sensitivity C-reactive protein. All other details are as given in the caption for ).
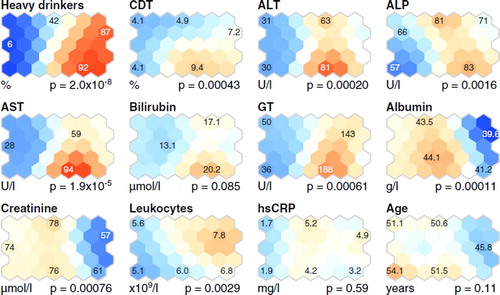
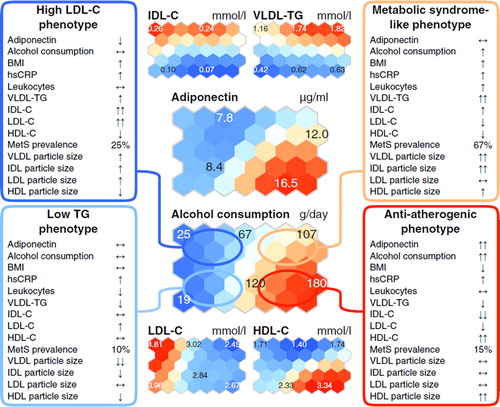
Figure 4. Summary of the metabolic and clinical characteristics in the study population of 80 heavy alcohol drinkers and 83 low-tomoderate drinkers (). The overall metabolic characteristics of the phenotypes, arisen from the SOM analysis of the lipoprotein data per se (for details see Subjects and methods, Self-organizing map analysis), are summarized within the boxes. Two downward (one downward, one upward, two upward) arrows indicate that the mean value for the group of individuals lies within the lowest (second lowest, second highest, highest) 20% of the values of all the individuals. Mean values that lie within the 20% of values around the median are indicated with horizontal arrows. All other details are as given in the caption for .