1,726
Views
10
CrossRef citations to date
0
Altmetric
Review Article

Proteomics in hypertension and other cardiovascular diseases

, &
Pages S55-S64 | Received 23 Sep 2011, Accepted 16 Jan 2012, Published online: 19 Jun 2012

Figures & data

Figure 1. Systems biology in the cardiovascular continuum. Cardiovascular disease progresses from risk factors to early and advanced stages of disease (Citation14). Genetic factors do not change during this development and are therefore suited to predict an organism's potential or risk already at early stages of life. The transcriptome, proteome, and metabolome change in parallel to the disease processes and are suited to characterize an organism's current state of disease.
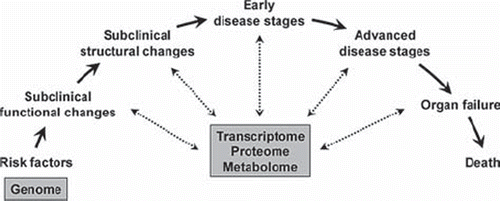
Figure 1. Systems biology in the cardiovascular continuum. Cardiovascular disease progresses from risk factors to early and advanced stages of disease (Citation14). Genetic factors do not change during this development and are therefore suited to predict an organism's potential or risk already at early stages of life. The transcriptome, proteome, and metabolome change in parallel to the disease processes and are suited to characterize an organism's current state of disease.

Figure 2. CAD-specific urinary polypeptide panel. Capillary electrophoresis coupled to mass spectrometry profiling of urine (upper panels) resulted in the definition of 238 polypeptides constituting a CAD-specific polypeptide panel (bottom panels). Normalized molecular weight (800–20,000 Da) in logarithmic scale is plotted against normalized migration time (18–45 min). The mean signal intensity of the polypeptide peak is given in 3D-depiction. Compiled data sets of patients suffering from CAD and controls are shown. The CAD-specific polypeptide pattern is magnified with a zoom factor of 4.5. Modified from (Citation34) with permission.
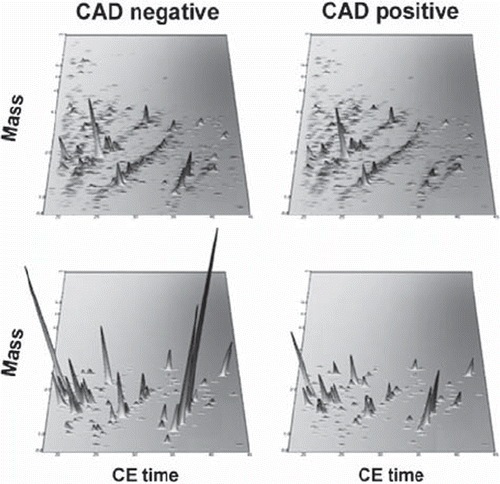
Figure 2. CAD-specific urinary polypeptide panel. Capillary electrophoresis coupled to mass spectrometry profiling of urine (upper panels) resulted in the definition of 238 polypeptides constituting a CAD-specific polypeptide panel (bottom panels). Normalized molecular weight (800–20,000 Da) in logarithmic scale is plotted against normalized migration time (18–45 min). The mean signal intensity of the polypeptide peak is given in 3D-depiction. Compiled data sets of patients suffering from CAD and controls are shown. The CAD-specific polypeptide pattern is magnified with a zoom factor of 4.5. Modified from (Citation34) with permission.

Reprints and Corporate Permissions

Please note: Selecting permissions does not provide access to the full text of the article, please see our help page How do I view content?

To request a reprint or corporate permissions for this article, please click on the relevant link below:

Academic Permissions

Please note: Selecting permissions does not provide access to the full text of the article, please see our help page How do I view content?

Obtain permissions instantly via Rightslink by clicking on the button below:

If you are unable to obtain permissions via Rightslink, please complete and submit this Permissions form. For more information, please visit our Permissions help page.