Figures & data
Figure 1. Study flow chart. (BMC = bone-marrow cells; fBM = Ficoll fractionated BMCs, i.e. mononuclear bone-marrow cells; fBM extract = fBM cells; HBSS = saline).
Figure 2. Diastolic and systolic B-mode echocardiography are presented as pairs at baseline before MI (top) and 28 days post-MI after fractionated bone-marrow cell therapy (left to right in upper row) by using Vevo 660 (VisualSonics, Toronto, Canada) high-resolution 30 MHz ultrasound system. Bottom row shows M-mode echo at day 2 after MI and changes in left ventricular parameters after the therapies. Individual changes were calculated by subtracting day 28 values from day 2 values.
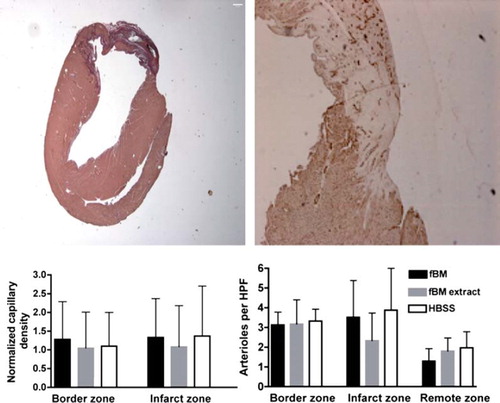
Figure 3. Basal section at midventricular short axis orientation demonstrates basal extent of myocardial infarct including infarct, border, and remote zone at the same slice from an animal with fBM treatment. Infarct size was measured by applying picrosirius staining (left) and capillary density by CD31 staining (right). Capillary densities at border zone and infarct zone are normalized individually to remote zone capillary density (left). Mean arteriole density in border zone, infarct zone, and remote zone measured by fluorescent microscopy from five high-power (40 ×) fields (right). Data are expressed as mean ± SD. All P values are non-significant (>0.05).