Figures & data
Figure 1. Prevalence and geographic clustering of the ten arrhythmia-associated mutations in Finland. A: Prevalence per 10,000 individuals and 95% confidence interval for each mutation in Finland. B: Division of Finland into four geographic regions. C: Prevalence and 95% confidence interval for each mutation in the different geographic regions shown in B.
Table I. Demographic characteristics of the study samples.
Table II. Prevalence and clinical information of mutation carriers.
Figure 2. Birthplaces of all FINRISK 1992, 1997, 2002, and Health 2000 participants. The dots are randomly located within the municipality of birth of the participants.
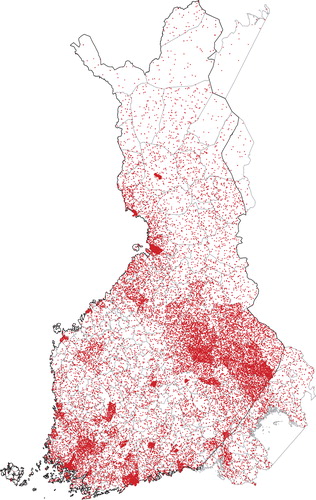
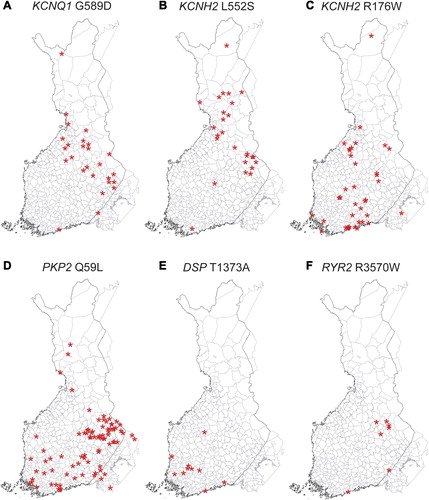
Figure 3. Birthplaces of the carriers of the six selected mutations. A: KCNQ1 G589D; B: KCNH2 L552S; C: KCNH2 R176W; D: PKP2 Q59L; E: DSP T1373A; F: RYR2 R3570W. The asterisks are randomly located within the municipality of birth of each mutation carrier. The corresponding distribution of birthplaces of all participants is shown in .