3,442
Views
168
CrossRef citations to date
0
Altmetric
Research Article

New population-based references for birth weight, length, and head circumference in singletons and twins from 23 to 43 gestation weeks

, , , &
Pages 446-454 | Received 08 Aug 2012, Accepted 07 May 2013, Published online: 14 Jun 2013

Figures & data

Table I. Frequencies of birth weight, length, and head circumference (HC) measurements by sex, gestation weeks, and maternal parity in singleton and twin boys (A), and in singleton and twin girls (B).

Figure 1. Mean (± 2 SD) birth weight, length, and head circumference (HC) references for gestational age in singleton boys and girls born in Finland in 1996–2008. (The numerical data are given in Supplementary Table IA.).
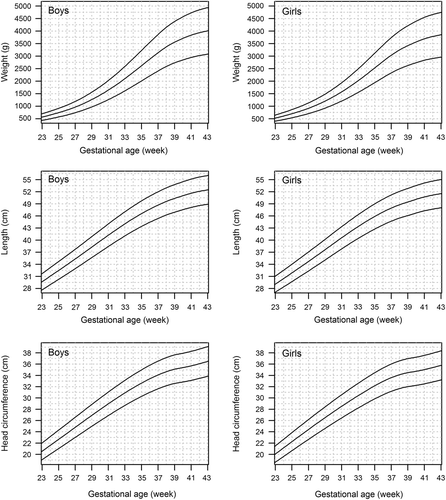
Figure 1. Mean (± 2 SD) birth weight, length, and head circumference (HC) references for gestational age in singleton boys and girls born in Finland in 1996–2008. (The numerical data are given in Supplementary Table IA.).

Figure 2. Change in the mean birth weight (right) and length (left) of singleton boys and girls from 1979–1983 (Citation16) to 1996–2008 (current data) in Finland. Curves indicate the difference from the population of 1979–1983. Solid line = boys born 1996–2008; dashed line = girls born 1996–2008.
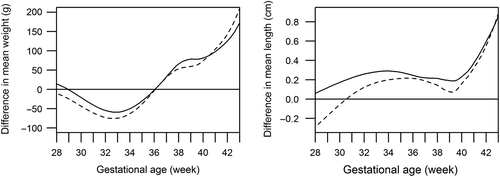
Figure 2. Change in the mean birth weight (right) and length (left) of singleton boys and girls from 1979–1983 (Citation16) to 1996–2008 (current data) in Finland. Curves indicate the difference from the population of 1979–1983. Solid line = boys born 1996–2008; dashed line = girls born 1996–2008.

Figure 3. Timing and magnitude of intrauterine growth difference between singletons and twins. Curves indicate the mean difference from the singleton newborns of same sex and gestational age. Solid line = twin boys; dashed line = twin girls. A: Difference in mean birth weight by gestational age; B: Difference in mean birth length by gestational age; C: Difference in birth head circumference (HC) by gestational age.
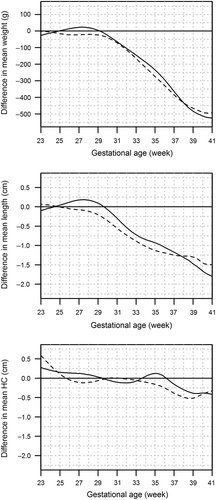
Figure 3. Timing and magnitude of intrauterine growth difference between singletons and twins. Curves indicate the mean difference from the singleton newborns of same sex and gestational age. Solid line = twin boys; dashed line = twin girls. A: Difference in mean birth weight by gestational age; B: Difference in mean birth length by gestational age; C: Difference in birth head circumference (HC) by gestational age.

Figure 4. Effect of parity on birth size. Sex-specific birth weight, length, and head circumference (HC) curves for primipara (black) and multipara (grey) singletons (solid lines) and twins (dotted lines). (The numerical data are given in Supplementary Table II.).
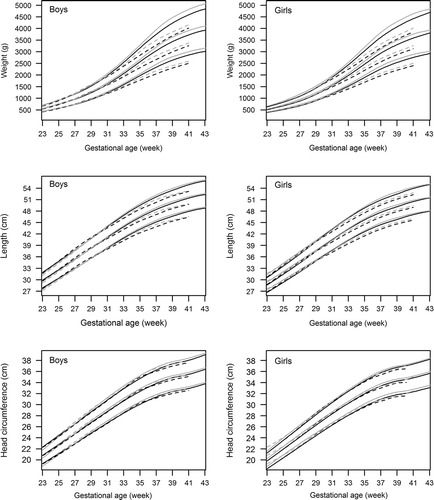
Figure 4. Effect of parity on birth size. Sex-specific birth weight, length, and head circumference (HC) curves for primipara (black) and multipara (grey) singletons (solid lines) and twins (dotted lines). (The numerical data are given in Supplementary Table II.).

Figure 5. A: Comparison of the birth weight reference of singleton boys (black solid line) to the reference calculated according to the method by Mikolajczyk et al. (Citation29) using population-based birth weight data at 40 gestation weeks (black dashed line). B: Comparison of the birth weight reference of Finnish singleton boys (black solid line) to the birth weight curves of Swedish boys (grey dashed line) (Citation26), UK boys (grey solid line) (Citation25), and US boys (black dashed line) (Citation27). The lines indicate 2nd, 50th, and 98th centiles corresponding to the mean and ± 2 SD curves in normal distribution.
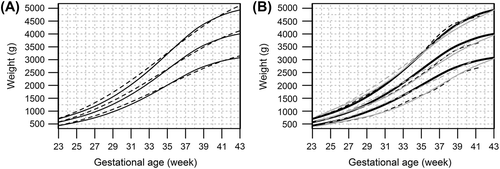
Figure 5. A: Comparison of the birth weight reference of singleton boys (black solid line) to the reference calculated according to the method by Mikolajczyk et al. (Citation29) using population-based birth weight data at 40 gestation weeks (black dashed line). B: Comparison of the birth weight reference of Finnish singleton boys (black solid line) to the birth weight curves of Swedish boys (grey dashed line) (Citation26), UK boys (grey solid line) (Citation25), and US boys (black dashed line) (Citation27). The lines indicate 2nd, 50th, and 98th centiles corresponding to the mean and ± 2 SD curves in normal distribution.
Supplemental material

http://informahealthcare.com/doi/10.3109/07853890.2013.803739

Download PDF (884.9 KB)

Reprints and Corporate Permissions

Please note: Selecting permissions does not provide access to the full text of the article, please see our help page How do I view content?

To request a reprint or corporate permissions for this article, please click on the relevant link below:

Academic Permissions

Please note: Selecting permissions does not provide access to the full text of the article, please see our help page How do I view content?

Obtain permissions instantly via Rightslink by clicking on the button below:

If you are unable to obtain permissions via Rightslink, please complete and submit this Permissions form. For more information, please visit our Permissions help page.