2,025
Views
32
CrossRef citations to date
0
Altmetric
ORIGINAL ARTICLE

Circadian abnormalities in a mouse model of high trait anxiety and depression

, , , , , & show all
Pages 148-154 | Received 13 Sep 2013, Accepted 04 Nov 2013, Published online: 10 Jan 2014

Figures & data

Figure 1. Study design for the analysis of the circadian behavioral phenotype in high and normal anxiety-like and depression-like mice. Light protocol used for the assessment of circadian wheel-running activity in selectively bred high and normal anxiety- and depression-like mice (HAB/NAB).

Figure 1. Study design for the analysis of the circadian behavioral phenotype in high and normal anxiety-like and depression-like mice. Light protocol used for the assessment of circadian wheel-running activity in selectively bred high and normal anxiety- and depression-like mice (HAB/NAB).

Figure 2. Alterations of the free-running circadian rhythm observed in HAB mice. (A) HAB mice display a significantly longer circadian period under free-running conditions (DD) than NAB mice. (B) No differences are observed under light-entrained conditions (LD). (C) and (D) HAB and NAB mice show comparable amounts of wheel running activity under DD (C) and LD (D) conditions during both their active (alpha) and inactive (rho) phases. *P < 0.05; data displayed as mean ± SEM.

Figure 2. Alterations of the free-running circadian rhythm observed in HAB mice. (A) HAB mice display a significantly longer circadian period under free-running conditions (DD) than NAB mice. (B) No differences are observed under light-entrained conditions (LD). (C) and (D) HAB and NAB mice show comparable amounts of wheel running activity under DD (C) and LD (D) conditions during both their active (alpha) and inactive (rho) phases. *P < 0.05; data displayed as mean ± SEM.

Figure 3. HAB mice display fragmented ultradiem rhythms. (A) Sample double-plotted actograms depicting wheel-running activity in NAB (left) and HAB (right) mice. Individual days are represented by horizontal rows with black vertical bars indicating locomotor activity (wheel revolutions). (B) and (C) HAB mice show significantly more activity bouts under both LD (B) and DD (C) conditions. * P < 0.05; data displayed as mean ± SEM.
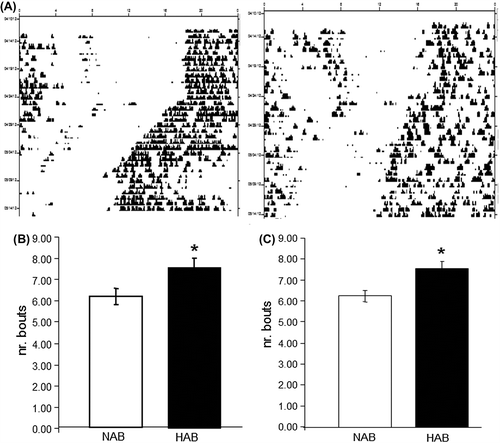
Figure 3. HAB mice display fragmented ultradiem rhythms. (A) Sample double-plotted actograms depicting wheel-running activity in NAB (left) and HAB (right) mice. Individual days are represented by horizontal rows with black vertical bars indicating locomotor activity (wheel revolutions). (B) and (C) HAB mice show significantly more activity bouts under both LD (B) and DD (C) conditions. * P < 0.05; data displayed as mean ± SEM.

Figure 4. Phase shift response is blunted in HAB mice. (A) A light-induced phase shift at CT 16 reveals a significantly diminished response in HAB mice as evidenced by a more than 50% reduction in the light-induced phase delay (hours). (B) and (C) Expression of Cry2 is significantly reduced at the mRNA level (B) and the protein level (C) in hippocampal tissue of HAB compared to NAB mice. *P < 0.05, **P < 0.01, ***P < 0.001; data displayed as mean ± SEM.

Figure 4. Phase shift response is blunted in HAB mice. (A) A light-induced phase shift at CT 16 reveals a significantly diminished response in HAB mice as evidenced by a more than 50% reduction in the light-induced phase delay (hours). (B) and (C) Expression of Cry2 is significantly reduced at the mRNA level (B) and the protein level (C) in hippocampal tissue of HAB compared to NAB mice. *P < 0.05, **P < 0.01, ***P < 0.001; data displayed as mean ± SEM.
Supplemental material

Supplementary Table I

Download PDF (34 KB)