
Figures & data
Table I. Characteristics of the study population.
Figure 1. Kaplan–Meier Curves by quintile of midregional pro-adrenomedullin (MR-proADM) for major adverse cardiac events (MACE) and heart failure after adjustment for age and gender. Dotted lines indicate the 95% confidence intervals. C1: Quintile 1, MR-proADM concentration < 0.36 nmol/L; C2: Quintile 2, MR-proADM concentration ≥ 0.36–0.48 nmol/L; C3: Quintile 3, MR-proADM concentration ≥ 0.48–0.50; C4: Quintile 4, MR-proADM concentration ≥ 0.50–0.59; C5: Quintile 5, MR-proADM concentration ≥ 0.59.
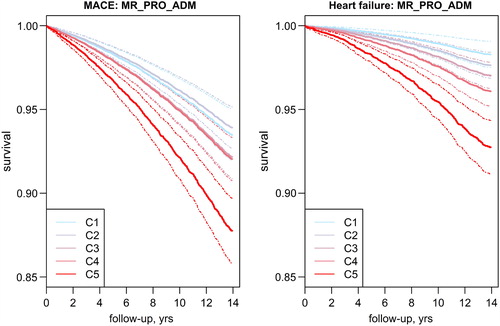
Figure 2. Hazard ratios of different outcomes for baseline midregional pro-adrenomedullin, N-terminal pro-brain natriuretic peptide, B-type natriuretic peptide, and midregional pro-atrial natriuretic peptide. Cox proportional hazards regression models comparing the highest quintile of each biomarker with the lowest quintile have been adjusted for the Framingham risk factors.
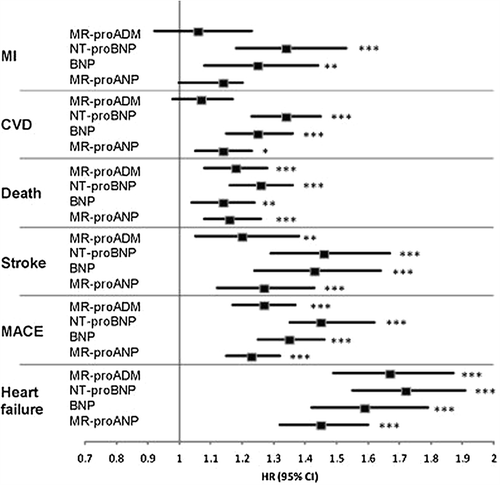
Table II. C-statistics and integrated discrimination improvement (IDI) for various cardiovascular outcomes due to adding baseline MR-proADM, NT-proBNP, BNP, and MR-proANP to the Framingham risk score.
Table III. Net reclassification improvement (NRI) and clinical NRI for various cardiovascular outcomes due to adding baseline MR-proADM, MR-proADM, NT-proBNP, BNP, and MR-proANP to the standard Framingham risk score.