Figures & data
Figure 1. The year 1800 is taken as a turning-point in the development of human reliance on artificial light. This period marked the beginning of the industrial revolution, and also when artificial light provided by candles, gas, and finally electricity became efficient and affordable. A logarithmic scale is required to allow comparison across the ages, also illustrating the large magnitude of the change in light consumption that occurred over a relatively short time period. A lumen hour is defined as the luminous energy equal to that emitted in 1 hour by a light source emitting a luminous flux of 1 lumen. This graph is redrawn from data reported by Fouquet and Pearson, 2006 (Citation89).
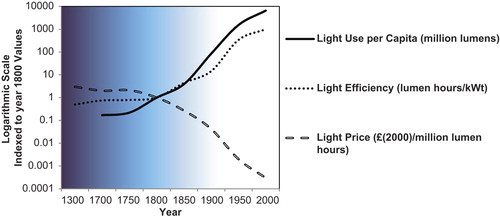
Figure 2. Advertisement for Edison Electric Illuminating Company of Brooklyn printed in the Brooklyn Institute of Arts and Sciences Bulletin, Volume 3, no. 16, December 25, 1909 and reproduced here with kind permission of the Brooklyn Museum Library.
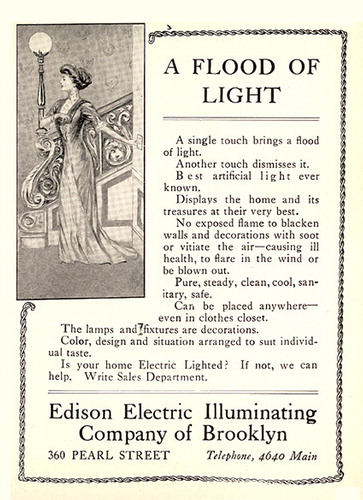
Figure 3. Biphasic sleep patterns are a feature of short photoperiod circadian rhythms in sheep (Wyse et al., unpublished data) and in humans sleeping in 10:14 L:D cycles in a laboratory, left (redrawn from data reported by Wehr et al., 1993 (Citation2)). This is in contrast to the single, consolidated sleep period, the Summer short nights. Note that the human data are sleep-recorded by EEG, and sheep data are locomotor activity.
Figure 4. Comparison of light exposure in Western lifestyle (orange) and camping in a mountainous region with no artificial light. Note the significant extension of artificial light into the dark period (arrow), as well as an overall reduction of total light exposure due to the dim days of artificial lighting. Reproduced with permission from Wright et al., 2013 (Citation6).
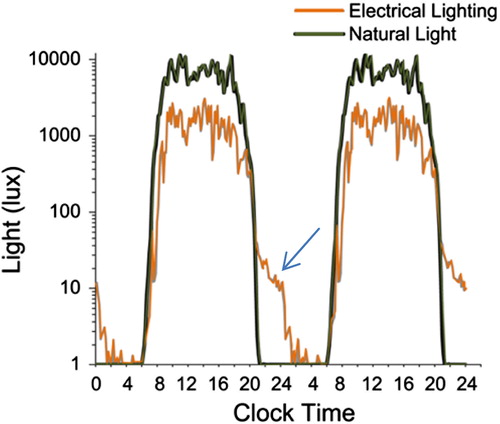
Figure 5. Summer term opening hours of the University of Aberdeen's library provide evidence of increasing extension of study time into the dark hours of night since electric light became available (Wyse et al., unpublished data).
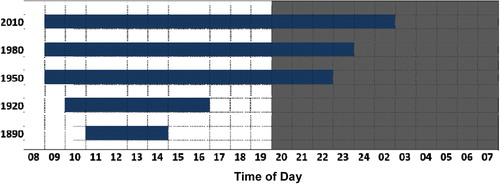
Figure 6. Relationship between lighting use and obesity. A: Average daily load profile for electricity demand in the UK (2009–2011; Winter) showing an early morning peak associated with waking, and an evening peak representing evening activities. Lunch time also is also represented by increased electricity consumption. Notice the progressive phase delay of the peak for wake time electricity use that occurs over the weekend, a typical human pattern of activity. B: Domestic energy consumption for lighting and appliances has increased in the UK, in parallel with increased prevalence of obesity. (Data sources: WHO Global Infobase https://apps.who.int/infobase/Index.aspx and Energy Consumption in the UK (ECUK) UK Government Department of Energy and Climate Change, Publication URN 13D/157, 2013.).
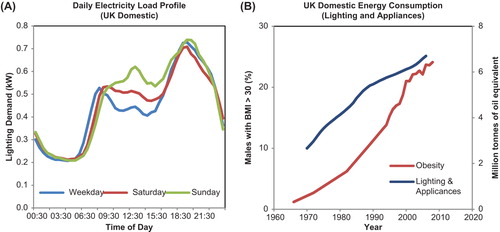
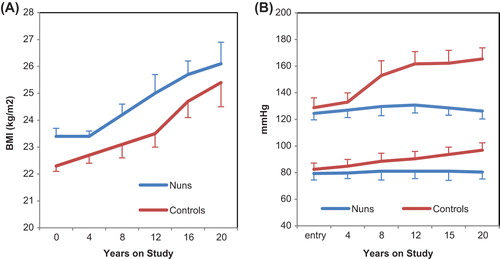
Figure 7. A cohort of Italian nuns in an enclosed order appeared to be protected from typical age-related increases in diastolic and systolic blood pressure of age-matched, unmarried control women (B). This is despite higher values of BMI in the nuns (A). Redrawn from.