
Figures & data
Table I. Frequency of HoFH, autosomal dominant form due to LDL-R mutations (ADH1).
Figure 1. Biochemical mechanisms of the activity of MTP of the inhibition of this assembly. A: (a) Synthesis of apo B occurs on the rough endoplasmic reticulum. (b) MTP consists of two subunits: the P subunit is the ubiquitous ER-resident enzyme protein disulfide isomerase (PDI), known to facilitate disulfide bond formation during nascent protein biosynthesis. The M subunit contains binding sites for apo B and lipids. (c) By interacting with nascent apo B, MTP facilitates its translocation, lipidation, and the prevention of degradation. (d) The apo B-containing lipoprotein is assembled. B: (e) MTP inhibition by mutation of the apo B binding site or following inhibitor use (f) leads apo B to proteasomal degradation via heat shock protein 70 (hsp70) and ubiquitination.
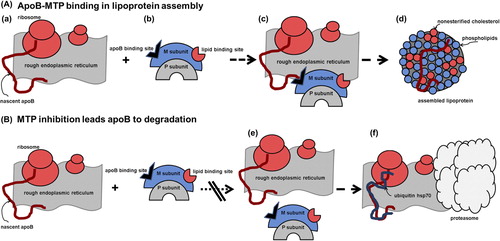
Figure 2. Cholesterol and triglyceride reductions in WHHL rabbits treated orally for 14 days with lomitapide (10 mg/kg). Total cholesterol and triglyceride levels were measured 18 hours after the last dose. Solid bars represent basal concentrations; diagonally hatched bars represent concentrations at the end of treatment. From ref. (Citation43) with permission.
Figure 3. Chemical structure of lomitapide.
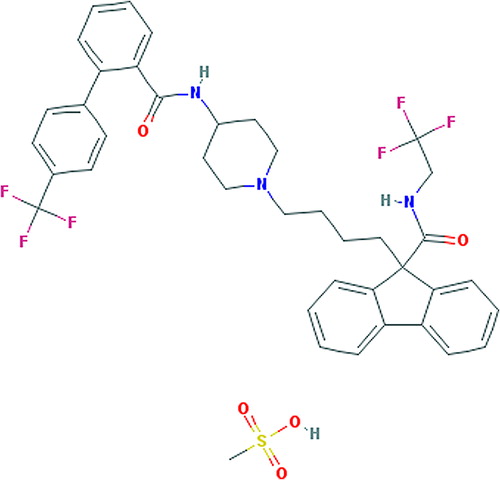
Table II. Evaluation of lomitapide in moderate hypercholesterolemic patients with and without ezetimibe (Citation52).
Figure 4. Mean percent changes in total, LDL-C, and apo B levels during the phase III study on lomitapide in HoFHs. From ref. (Citation53) with permission.
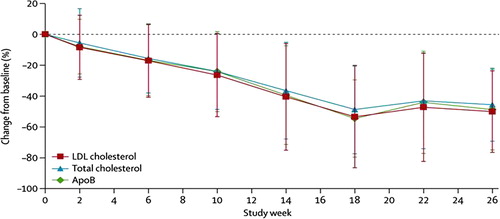
Table III. LDL-Cholesterol responses to lomitapide of homozygous FH patients according to residual LDL-R activity and to predicted LDL-R classes of mutation.