Figures & data
Figure 1. Study selection process.
Table I. Characteristics of studies included in systematic review.
Table II. Study quality characteristics.
Table III. Summary of findings of meta-analysis.
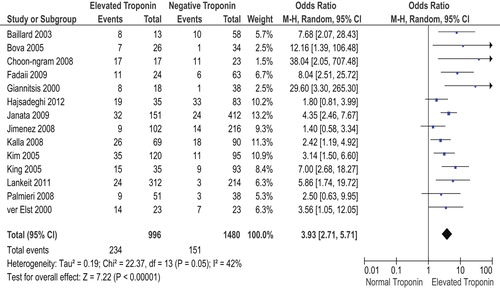
Figure 2. Forest plot of short-term (in-hospital and ≤ 30 days) mortality in elevated troponin versus normal troponin groups.
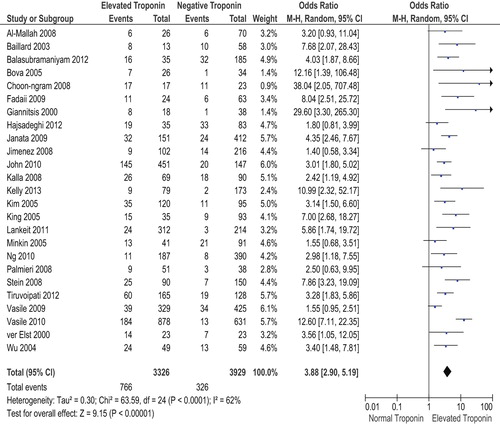
Figure 3. Forest plot of long-term (≥ 6 months) mortality in elevated troponin versus normal troponin groups.
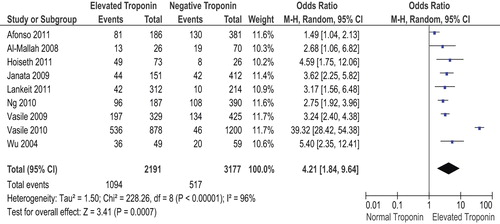
Figure 4. Forest plot of short-term mortality with pooled adjusted ORs.
Figure 5. Forest plot of reason for admission; critical illness/ICU.
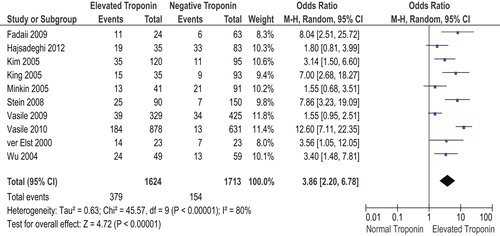
Figure 6. Forest plot of reason for admission; sepsis.
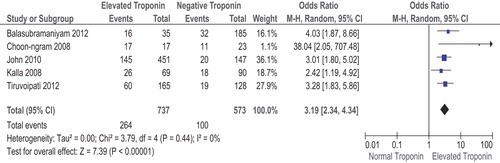
Figure 7. Forest plot of reason for admission; COPD.
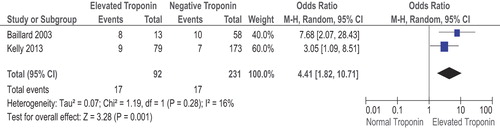
Figure 8. Forest plot of reason for admission; PE.
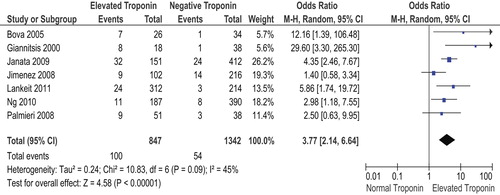
Figure 9. Forest plot of short-term mortality in troponin I studies.
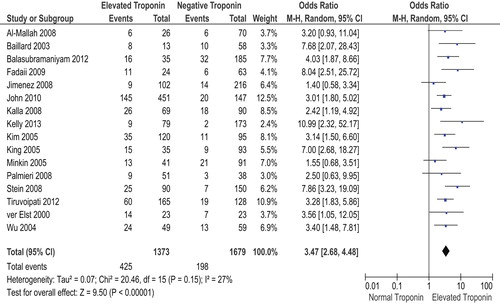
Figure 10. Forest plot of short-term mortality in troponin T studies.
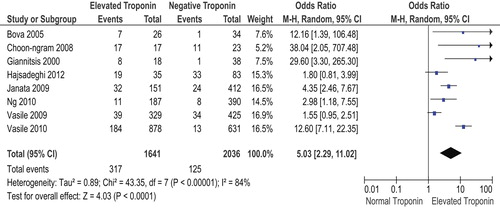
Figure 11. Forest plot of short-term mortality in retrospective studies.
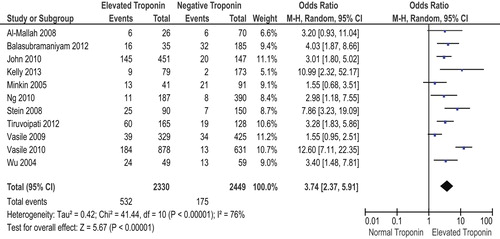
Figure 12. Forest plot of short-term mortality in prospective studies.