Figures & data
Figure 1. Changes in chronic obstructive pulmonary disease (COPD) severities during the 6-year follow-up. COPD was classified according to the recommendations of the 2007 Global Initiative for Chronic Lung Disease (GOLD). The second visit (Visit 2) was organized 3 years after the baseline examination, and the last visit (Visit 3) after 6 years of follow-up.
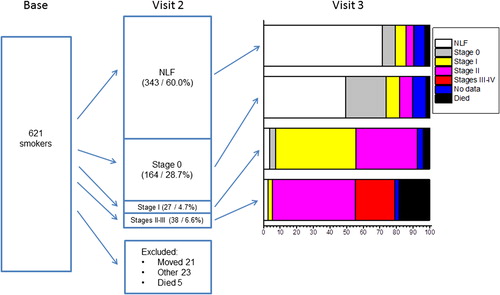
Table I. Basic clinical characteristics of 513 study subjects from Northern Finland subdivided by GOLD 2007 COPD stages at the end of the 6-year follow-up study.
Table II. Distribution of GOLD 2011 grades, symptoms, exacerbations, and hospitalizations subdivided according to GOLD 2007 stages of the 117 participants with chronic obstructive pulmonary disease after 6-year follow-up.
Figure 2. Distribution of COPD Assessment Test (CAT) score by COPD status at the end of the 6-year follow-up study of 513 participants. P value of one-way ANOVA linear test was < 0.001.
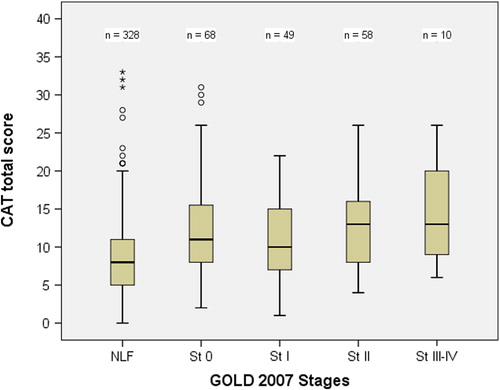
Figure 3. Percentage distribution of the modified British Medical Research Council (mMRC) categories of the 513 participants at the 6-year follow-up visit subdivided by their COPD status. P value of chi-square test for linear trend was < 0.001.
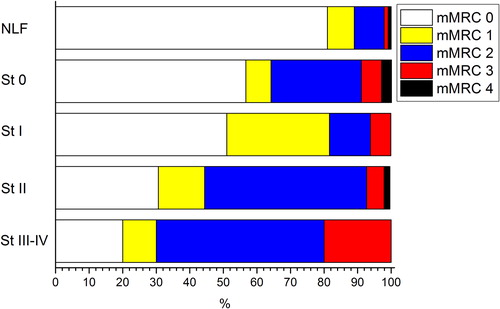
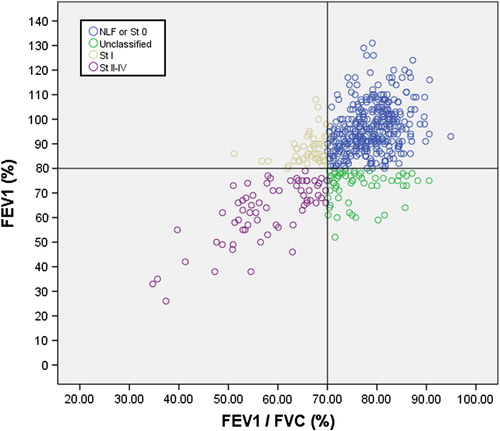
Figure 4. Scatterplot of forced expiratory volume in 1 second (FEV1) versus FEV1/FVC in spirometry with bronchodilatation test. COPD is classified by GOLD 2007 recommendations in the study with 513 participants. Stage 0 refers to cases with normal lung function and with chronic bronchitis. Unclassified COPD refers to FEV1 (%) < 80% predicted and FEV1/FVC (%) > 70% in BD spirometry.