Figures & data
Table I. The 10 most up- and downregulated genes in stenotic valves compared to control valves.
Figure 1. Valvular calcification and neovascularization in aortic valves. A: The proportion of calcified area in human aortic valve cusps to total aortic valve cusp area. B: Number of vascular structures per square millimeter in human aortic valve cusps. Results are mean ± SEM. ***P < 0.001 versus control group (Ctrl; n = 13); †††P < 0.001, ††P < 0.01 versus fibro(sclero)sis group (Fibr; n = 12). Aortic stenosis group (AS; n = 28).
Figure 2. Expression of miRNAs in human aortic valves. A: A heat map diagram showing the results of two-way hierarchical clustering of miRNAs. Each row represents a miRNA and each column represents a sample. The miRNA clustering tree is shown on the left. The color scale shown at the bottom illustrates the relative expression level of miRNA across the samples: red color, expression level above mean; blue color, expression lower than the mean; gray color, signal below background. B–G: Expression levels of miR-125b (B), miR-939 (C), miR-602 (D), miR-374b* (E), miR-665 (F), and miR-193b (G) in human aortic valve cusps in control (Ctrl, n = 6) and aortic stenosis group (AS, n = 20) as measured by quantitative RT-PCR. Results are expressed as ratios of miRNA to SNORA73 (mean ± SEM). *P < 0.05, ***P < 0.001 versus control group (Student's t test or Mann–Whitney U test).
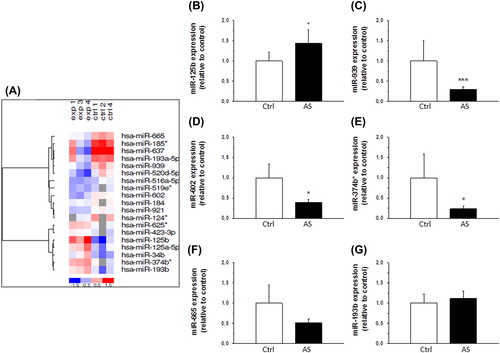
Figure 3. DNA microarray analysis of calcific aortic valve disease. A: The open bars show the number of downregulated and the solid bars upregulated genes in human aortic valve cusps in fibro(sclero)sis group (Fibr) versus control group (Ctrl), aortic stenosis group (AS) versus Fibr, and AS versus Ctrl. B: Functional classification of differentially expressed genes in human aortic valve cusps in AS versus Ctrl group revealing upregulation of many chemokines (listed and ranked by fold change in the inset table).
Figure 4. A–B: Gene expression of chemokine (C-C motif) ligand 3 (CCL3) (A) and CCL4 (B) in control valves and in the different stages of calcific aortic valve disease. Results are expressed as ratios of respective mRNA to 18S (mean ± SEM). *P < 0.05 versus control group. Ctrl, n = 9; Fibr, n = 7; AS, n = 25. C: Correlation of CCL4 mRNA 3’-UTR seed region and miR-125b sequence indicating a potential regulatory relationship, as predicted by MicroCosm software. D: Production of CCL4 protein by human THP-1 macrophages 24 hours after transfection with transfection agent alone (mock), scrambled miRNA (negative miRNA control), or miRNA-125b. Results from three independent experiments are presented as mean ± SEM.
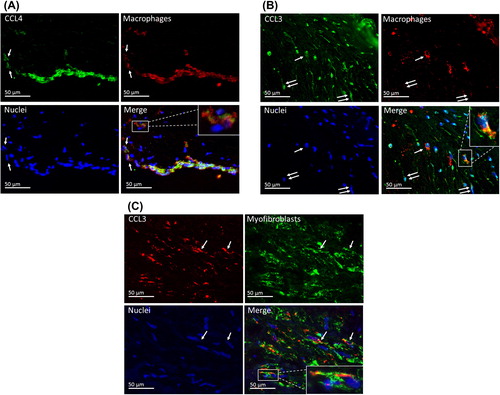
Figure 5. Chemokine localization in aortic valves. A: CCL4 is expressed in macrophages. In this area, there is a strand of subendothelial macrophages as well as some scattered macrophages (arrows), in which the co-localization of CCL4 and CD68 is seen. Detailed image of a single macrophage is shown in the inset. B: CCL3 is expressed in some macrophages (arrow) and CD68-negative spindle cells (double arrows). Detailed image of a single macrophage is shown in the inset. C: In this focus, there are several α-SMA-positive myofibroblasts. Some of these co-express CCL3 (arrows).