1,372
Views
50
CrossRef citations to date
0
Altmetric
ORIGINAL ARTICLE

MicroRNA profiling in migraine without aura: Pilot study

, , , , , , , , & show all
Pages 468-473 | Received 20 Jan 2015, Accepted 07 Jul 2015, Published online: 17 Aug 2015

Figures & data

Figure 1. MiRNome analysis for circulating microRNAs in migraine. Schematic representation of circulating microRNAs as modulated by migraine. The x-axis indicates fold change in expression level on a log10 scale as compared to control subjects.
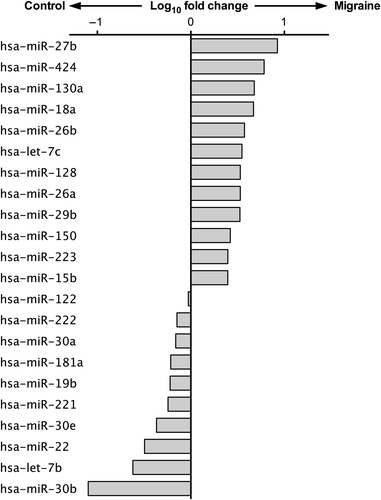
Figure 1. MiRNome analysis for circulating microRNAs in migraine. Schematic representation of circulating microRNAs as modulated by migraine. The x-axis indicates fold change in expression level on a log10 scale as compared to control subjects.

Figure 2. Validation of circulating microRNAs expression on individual plasma samples by qRT-PCR. Data are shown as fold change from the control group. Significance levels were assessed by Mann–Whitney U test. * q < 0.05; ** q < 0.01; *** q < 0.001 (probability values corrected for multiple comparison by the Benjamini–Hochberg FDR method; n = 13 for control subjects, n = 15 for migraine patients).
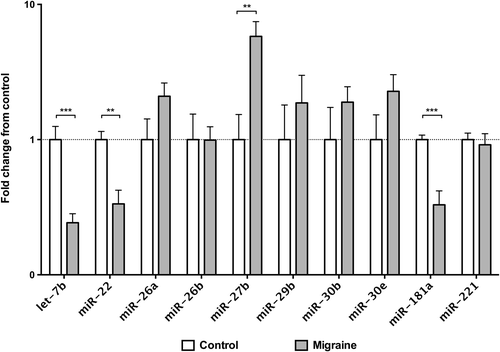
Figure 2. Validation of circulating microRNAs expression on individual plasma samples by qRT-PCR. Data are shown as fold change from the control group. Significance levels were assessed by Mann–Whitney U test. * q < 0.05; ** q < 0.01; *** q < 0.001 (probability values corrected for multiple comparison by the Benjamini–Hochberg FDR method; n = 13 for control subjects, n = 15 for migraine patients).

Figure 3. Receiver-operating characteristic (ROC) curve derived from the logistic regression model developed with circulating let-7b, miR-22, miR-27b, and miR-181a as predictors. AUC = area under curve.
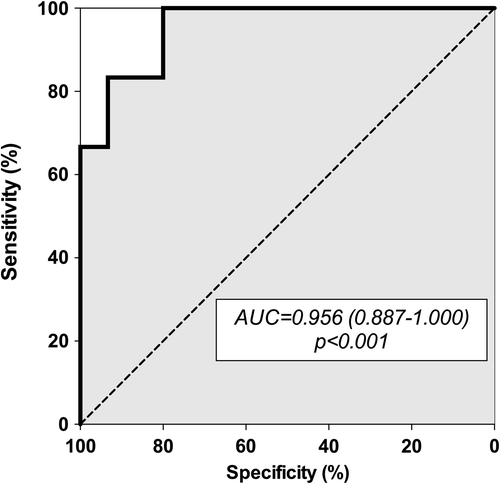
Figure 3. Receiver-operating characteristic (ROC) curve derived from the logistic regression model developed with circulating let-7b, miR-22, miR-27b, and miR-181a as predictors. AUC = area under curve.

Figure 4. Expression of microRNAs in peripheral blood mononuclear cells (PBMCs) assessed by qRT-PCR. Data are shown as fold change from the control group. Significance levels were assessed by Mann–Whitney U test. *P < 0.05; ** P < 0.01; *** P < 0.001 (n = 13 for control subjects, n = 15 for migraine patients).
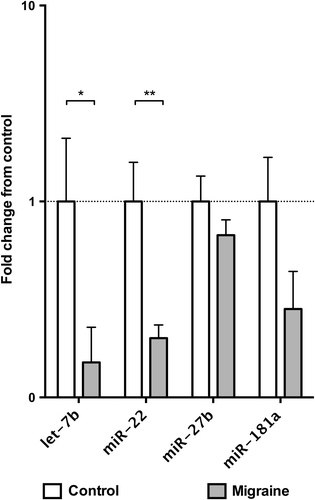
Figure 4. Expression of microRNAs in peripheral blood mononuclear cells (PBMCs) assessed by qRT-PCR. Data are shown as fold change from the control group. Significance levels were assessed by Mann–Whitney U test. *P < 0.05; ** P < 0.01; *** P < 0.001 (n = 13 for control subjects, n = 15 for migraine patients).
Supplemental material

iann_a_1071871_sm8577.pdf

Download PDF (584.6 KB)

Reprints and Corporate Permissions

Please note: Selecting permissions does not provide access to the full text of the article, please see our help page How do I view content?

To request a reprint or corporate permissions for this article, please click on the relevant link below:

Academic Permissions

Please note: Selecting permissions does not provide access to the full text of the article, please see our help page How do I view content?

Obtain permissions instantly via Rightslink by clicking on the button below:

If you are unable to obtain permissions via Rightslink, please complete and submit this Permissions form. For more information, please visit our Permissions help page.