Figures & data
Figure 1. Selection of the population with normal sleep. *Sleep complaints: mainly environmental disturbances. **More than twice per week. ***Documented sleep disorder (insomnia, sleep-related breathing disorders or frequent awakenings due to other problems). 4% ODI = 4% oxygen desaturation index; PLMI = periodic leg movement index. All percentages are relative to the total population subjectively (n = 5,064) or objectively (n = 2,160) investigated.
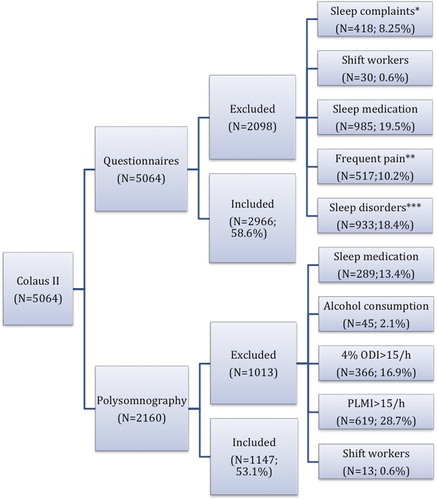
Table I. Effects of age and gender on sleep habits.
Figure 2. (A) The prevalence of morning (black line) and evening type (red line) according to age (n = 2,966). Morning types were all ‘definite’ or ‘moderate’ morning type participants, and all participants included in ‘definite’ and ‘moderate’ evening type were considered as evening type. Black asterisks mark significant differences between age groups (multinomial logistic regression, P < 0.001). (B) Declared sleep duration (minutes): black bars represent men and red bars women; black lines connect significantly different age groups, and asterisks mark gender differences (two-way analysis of variance with factors ‘age group’, P < 0.05, ‘gender’, P < 0.05, and ‘age group × gender’, P = n.s.). (C) Daytime functioning (red line) and sleep quality (black line) improves with aging (asterisks mark significant differences between age groups, chi-square test, P < 0.001; each point represents the percentage of the participants rating their daytime functioning and sleep quality as very good). (D) The prevalence of excessive daytime sleepiness decreases with aging: black bars represent men and red bars women; asterisks mark gender differences (chi-square test, P < 0.001). Excessive daytime sleepiness was considered based on the ESS scores, using a cut-off of 10.
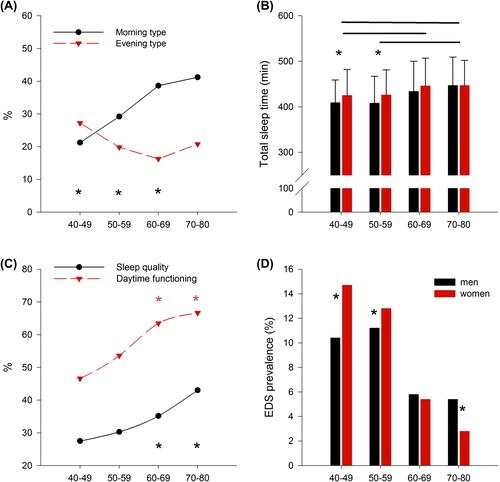
Table II. Effects of age on chronotype.
Table III. Effects of age and gender on variables assessed by polysomnography.
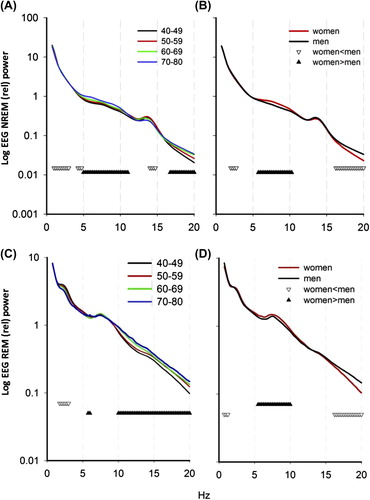
Figure 3. Effect of age (A) and gender (B) on NREM-relative EEG spectral power (n = 776, logarithmic scale). Down-oriented triangles connect frequencies for which power densities were significantly decreased with age, while up-oriented triangles connect frequencies for which power densities were significantly increased with age. Effect of age (C) and gender (D) on REM sleep-relative EEG spectral power. Down-oriented triangles connect frequencies for which power densities were significantly decreased with age, while up-oriented triangles connect frequencies for which power densities were significantly increased with age (P < 0.05). EEG power spectra were normalized by dividing the power in each 0.25 Hz bin by the total power for NREM and REM sleep, respectively, over the 0.75–30 Hz frequency range. (Two-way ANOVA for factors ‘age group’, P < 0.05, ‘bin’, P < 0.0001, and ‘age group × bin’, P < 0.05, and for factors ‘gender’, ‘bin’, and their interaction, P < 0.05). Overall, 60–69 y.o. and 70–80 y.o. groups differed significantly from 40–49 y.o. and 50–59 y.o.