Figures & data
Figure 1. Telomere length, expressed as the telomere-to-single-reference-gene (T/S) ratio, is plotted as a function of age. Telomere length decreases with age at a mean yearly rate of 0.005 ± 0.001 in T/S ratio (P = 2.21 × 10⁻⁹). Shaded is the 95% confidence interval of the mean.
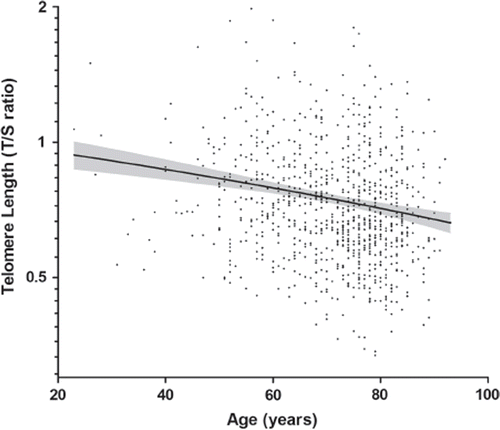
Table I. Base-line characteristics.
Table II. Clinical and biochemical associations with telomere length.
Figure 2. Kaplan-Meier curves for outcome according to quartile of telomere length. The telomere length quartiles were as follows: first quartile, less than 0.59; second quartile 0.59 to 0.69; third quartile 0.69 to 0.86; and fourth quartile, more than 0.86. P = 0.009 by the log-rank test for the overall comparison among groups.
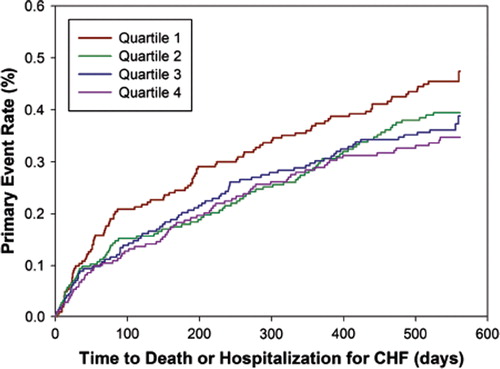
Figure 3. Hazard ratios per unit decrease in telomere length ratio for outcome. The (adjusted) hazard ratio and 95% confidence intervals (CI) are shown for the primary outcome for telomere length ratio univariately (model 1), after adjustment for age, age of CHF onset, and gender (model 2), the model after adjustment for the covariates selected by forward and backward stepwise conditional selection (model 3), the model after adjustment for the covariates selected by the multivariable fractional polynominal closed-test algorithm (model 4), and the model after adjustment for the covariates selected by the Royston and Altman model selection algorithm (model 5). CHF = chronic heart failure; NT-proBNP = N-terminal pro-B-type natriuretic peptide; Hb = hemoglobin; EGFR = estimated renal function; CVA = history of cerebrovascular accident.
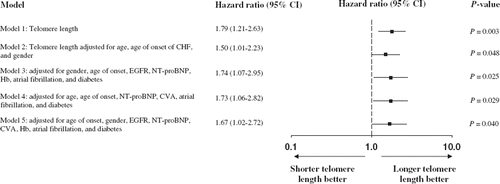
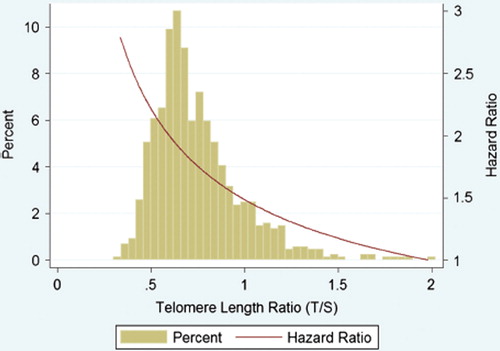
Figure 4. Distribution of telomere length and associated hazard ratio. The green bars represent the histogram of the untransformed telomere length ratio (horizontal axis versus percentage on left vertical axis). The red line represents the estimated hazard ratio for the primary end-point (total mortality and hospitalization for heart failure) after multivariable adjustment for age of onset, gender, estimated renal function, N-terminal pro-B-type natriuretic peptide, hemoglobin, a history of atrial fibrillation, and diabetes (model 3).