Figures & data
Table I. Participant characteristics.
Figure 1. Changes in flow-mediated vasodilatation (FMD) after high glucose intake at different time points in three groups The difference in FMD among the three groups were statistically significant at each time point (all, p < 0.05). After adjustment using the Bonferroni method, control group vs primary hypertension (PH) and control group vs PH+ metformin (MF) were significantly different at all four time points (all, p < 0.05). PH vs PH+ MF was statistically significant at 1-h time point only (p < 0.05). Data were expressed as mean ± SD. Outliers were excluded.
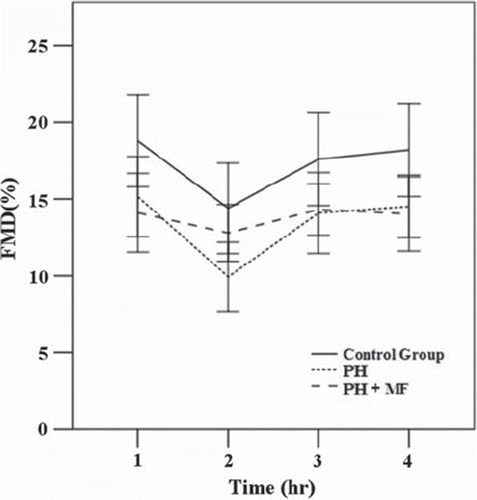
Figure 2. The effects of metformin (MF) after glucose load. The changes in (A) flow-mediated vasodilatation (FMD) and the changes in the serum levels of (B) superoxide dismutase (SOD), (C) total antioxidant capacity (T-AOC), (D) anti-superoxide anion free radical (AntiO2), and (E) free fatty acids (FFA) before and 1 h after administration of the glucose load were compared among the three groups. (A) There were significant differences in FMD between the control group and primary hypertension (PH)+ MF group, and the PH group and PH+ MF group (both, p < 0.001). (B) No significant difference in SOD was found between any two groups (all, p > 0.05). (C) There were significant differences in T-AOC between the control group and PH+ MF group, and between the PH group and the PH+ MF group (both, p < 0.001). (D) There were significant differences in AntiO2 between any two groups (all, p < 0.001). (E) There were significant differences in FFA between the control group and PH+ MF group, and between the PH group and PH+ MF group (both, p < 0.001). Data were expressed by mean ± SD. *Indicated there was significant difference. Outliers were excluded.
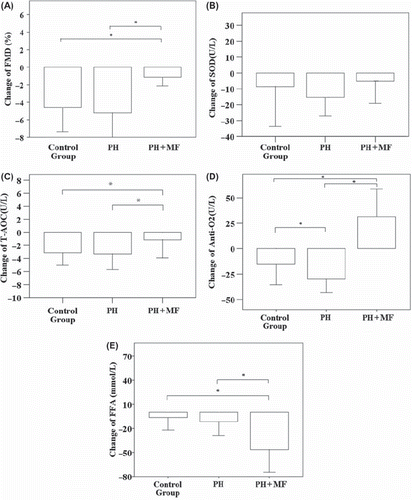
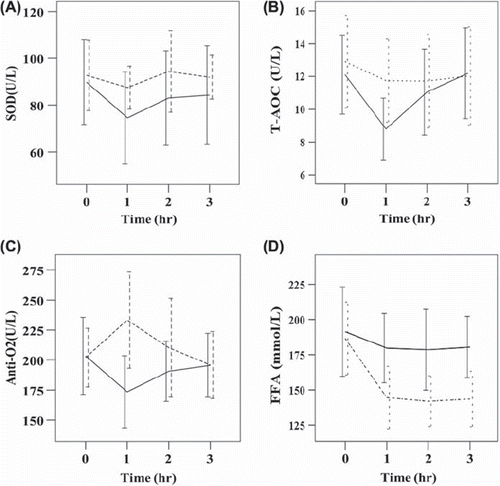
Figure 3. The effect of metformin (MF) on serum antioxidant and free fatty acids (FFA) levels over time in the patients with primary hypertension. The serum levels of (A) superoxide dismutase (SOD), (B) total antioxidant capacity (T-AOC), (C) anti-superoxide anion free radical (AntiO2), and (D) FFA at four time points before and after the oral glucose load were compared between primary hypertension (PH) and PH+ MF groups. Dashed line, PH+ MF group; solid line, PH group. There were significant differences in SOD (p < 0.001), T-AOC (p = 0.005), AntiO2 (p < 0.001), and FFA (p < 0.001) between the two groups over four time points. Data were expressed by mean ± SD. Outliers were excluded.