524
Views
23
CrossRef citations to date
0
Altmetric
Research Article

Local application of tropicamide 0.5% reduces retinal capillary blood flow

, , &
Pages 371-376 | Received 01 Sep 2012, Accepted 18 Feb 2013, Published online: 18 Apr 2013

Figures & data

Figure 1. Mean of retinal capillary blood flow before (OD-before; OS-before) and 30 min after tropicamide application to the right eye (OD-tropicamide; OS-control). OD, right eyes; OS, left eyes; significance **p < 0.01 (Wilcoxon test).
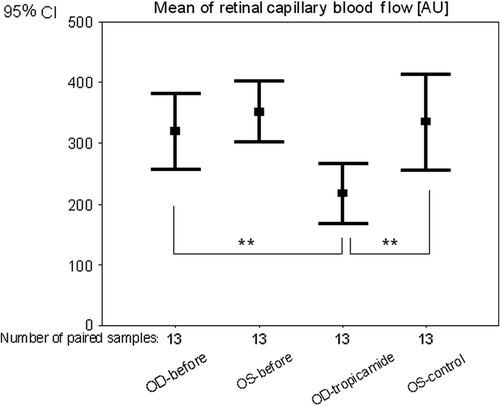
Figure 1. Mean of retinal capillary blood flow before (OD-before; OS-before) and 30 min after tropicamide application to the right eye (OD-tropicamide; OS-control). OD, right eyes; OS, left eyes; significance **p < 0.01 (Wilcoxon test).

Table I. Mean ± standard deviation (SD) of retinal capillary blood flow (RCF) before and 30 min after tropicamide application to the right eye (tropicamide); left eye (control).

Figure 2. Mean differences in percent of baseline of retinal capillary blood flow 30 min after tropicamide application to the right eye and retinal capillary blood flow before application. OD, right eyes with local tropicamide application; OS, left eyes without tropicamide; significance **p < 0.01 (Wilcoxon test).
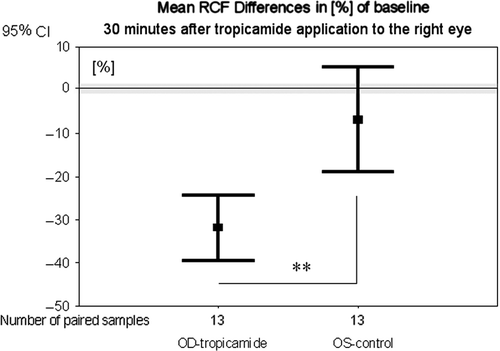
Figure 2. Mean differences in percent of baseline of retinal capillary blood flow 30 min after tropicamide application to the right eye and retinal capillary blood flow before application. OD, right eyes with local tropicamide application; OS, left eyes without tropicamide; significance **p < 0.01 (Wilcoxon test).

Figure 3. Mean of retinal capillary blood flow (RCF) before, 1, 5, 10, 15, 20 and 30 min after tropicamide application to the right eye; N, number of paired samples; significance *0.05 ≥ p ≥ 0.01, comparison of RCF between the right eyes and the left eyes; #comparison between RCF in the time of the measurement after and before tropicamide application (Wilcoxon test).
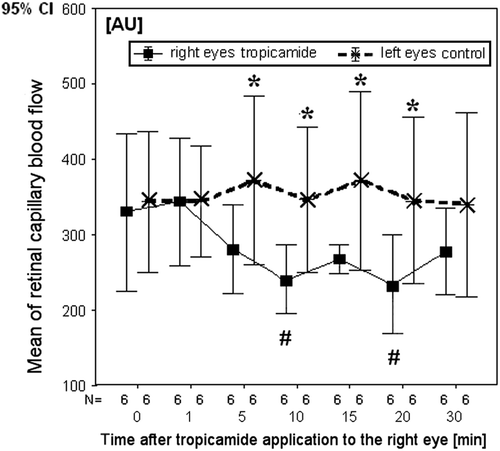
Figure 3. Mean of retinal capillary blood flow (RCF) before, 1, 5, 10, 15, 20 and 30 min after tropicamide application to the right eye; N, number of paired samples; significance *0.05 ≥ p ≥ 0.01, comparison of RCF between the right eyes and the left eyes; #comparison between RCF in the time of the measurement after and before tropicamide application (Wilcoxon test).

Table II. Mean ± standard deviation (SD) of retinal capillary blood flow (RCF) before, 1, 5, 10, 15, 20 and 30 min after tropicamide to the right eye; OD/OS difference – difference between RCF of the right eyes (OD) and control left eyes (OS).

Reprints and Corporate Permissions

Please note: Selecting permissions does not provide access to the full text of the article, please see our help page How do I view content?

To request a reprint or corporate permissions for this article, please click on the relevant link below:

Academic Permissions

Please note: Selecting permissions does not provide access to the full text of the article, please see our help page How do I view content?

Obtain permissions instantly via Rightslink by clicking on the button below:

If you are unable to obtain permissions via Rightslink, please complete and submit this Permissions form. For more information, please visit our Permissions help page.