534
Views
13
CrossRef citations to date
0
Altmetric
Original Article

Impact of blood glucose variability on carotid artery intima media thickness and distensibility in type 1 diabetes mellitus

, , , , , , , , , , , , & show all
Pages 355-361 | Received 26 Nov 2012, Accepted 13 Mar 2013, Published online: 17 Jul 2013

Figures & data

Table I. Demographic and hemodynamic findings in type I diabetic patients without microvascular complications enrolled in the study.

Table II. Characteristics of blood glucose metabolism and of carotid artery in the 17 type I diabetics patients enrolled in the study.

Figure 1. Pearson's correlation coefficients of the relationships between right carotid intima-media thickness, carotid artery distensibility and anthropometric, hemodynamic and metabolic parameters. SBP, systolic blood pressure; DBP, diastolic blood; TC, total cholesterol; HR, heart rate; PPHS, postprandial hyperglycemic spikes; DMD, diabetes mellitus duration; FBG, fasting blood glucose; 24h-BG, mean blood glucose of the 24 hours; BG-SD, blood glucose standard deviation; MAGE, mean amplitude of glucose excursion.
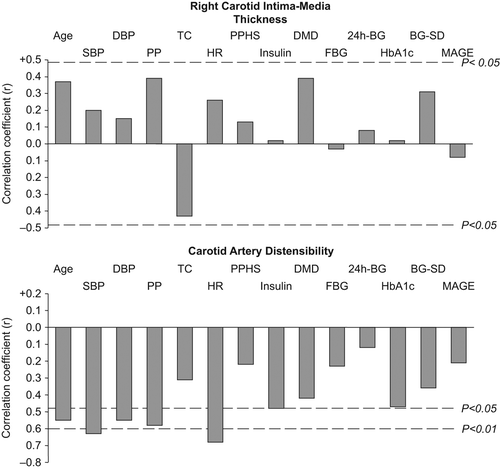
Figure 1. Pearson's correlation coefficients of the relationships between right carotid intima-media thickness, carotid artery distensibility and anthropometric, hemodynamic and metabolic parameters. SBP, systolic blood pressure; DBP, diastolic blood; TC, total cholesterol; HR, heart rate; PPHS, postprandial hyperglycemic spikes; DMD, diabetes mellitus duration; FBG, fasting blood glucose; 24h-BG, mean blood glucose of the 24 hours; BG-SD, blood glucose standard deviation; MAGE, mean amplitude of glucose excursion.

Figure 2. Pearson's correlation coefficients of the relationships between blood glucose standard deviation and mean amplitude of glucose excursion with other parameters of blood glucose metabolism. DMD, diabetes mellitus duration; FBG, fasting blood glucose; 24h-BG, mean blood glucose of the 24 hours; PPHS, postprandial hyperglycemic spikes; MAGE, mean amplitude of glucose excursion; BG-SD, blood glucose standard deviation.
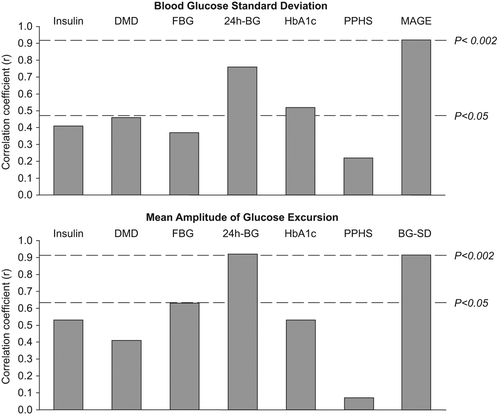
Figure 2. Pearson's correlation coefficients of the relationships between blood glucose standard deviation and mean amplitude of glucose excursion with other parameters of blood glucose metabolism. DMD, diabetes mellitus duration; FBG, fasting blood glucose; 24h-BG, mean blood glucose of the 24 hours; PPHS, postprandial hyperglycemic spikes; MAGE, mean amplitude of glucose excursion; BG-SD, blood glucose standard deviation.

Reprints and Corporate Permissions

Please note: Selecting permissions does not provide access to the full text of the article, please see our help page How do I view content?

To request a reprint or corporate permissions for this article, please click on the relevant link below:

Academic Permissions

Please note: Selecting permissions does not provide access to the full text of the article, please see our help page How do I view content?

Obtain permissions instantly via Rightslink by clicking on the button below:

If you are unable to obtain permissions via Rightslink, please complete and submit this Permissions form. For more information, please visit our Permissions help page.