289
Views
2
CrossRef citations to date
0
Altmetric
ORIGINAL ARTICLE

Impact of fasting glucose on electrocardiographic left ventricular hypertrophy in an elderly general population

, , , , , & show all
Pages 164-173 | Received 18 Jan 2015, Accepted 10 Mar 2015, Published online: 17 Apr 2015

Figures & data

Table Ia. Characteristics of the male patients (with a history of cardiovascular event or cardiovascular, antidiabetic or lipid-lowering medical treatment).

Table Ib. Characteristics of the female patients (with a history of cardiovascular event or cardiovascular, antidiabetic or lipid-lowering medical treatment).

Table IIa. Characteristics of the healthy male subjects (without a history of cardiovascular event or cardiovascular, antidiabetic or lipid-lowering medical treatment).

Table IIb. Characteristics of the healthy female subjects (without a history of cardiovascular event or cardiovascular, anti-diabetic or lipid-lowering medical treatment).

Figure 1. Differences between electrocardiographic markers of left ventricular hypertrophy among fasting plasma glucose groups. p, p value for difference between the groups analyzed using one-way analysis of variance; n, number; NFG, normal fasting glucose; IFG, impaired fasting glucose; DM, diabetes mellitus.
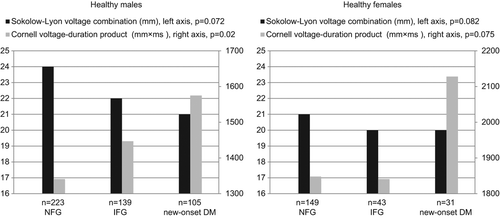
Figure 1. Differences between electrocardiographic markers of left ventricular hypertrophy among fasting plasma glucose groups. p, p value for difference between the groups analyzed using one-way analysis of variance; n, number; NFG, normal fasting glucose; IFG, impaired fasting glucose; DM, diabetes mellitus.

Figure 2. Odds ratios (×) and 95% confidence intervals for the independent explanatory factors for the presence of electrocardiographically identified left ventricular hypertrophy in healthy males.

Figure 2. Odds ratios (×) and 95% confidence intervals for the independent explanatory factors for the presence of electrocardiographically identified left ventricular hypertrophy in healthy males.

Table III. Independent explanatory factors for the presence of electrocardiographically identified left ventricular hypertrophy.

Table IV. Independent explanatory factors for Sokolow–Lyon voltage combination.

Table V. Independent explanatory factors for Cornell voltage–duration product.

Reprints and Corporate Permissions

Please note: Selecting permissions does not provide access to the full text of the article, please see our help page How do I view content?

To request a reprint or corporate permissions for this article, please click on the relevant link below:

Academic Permissions

Please note: Selecting permissions does not provide access to the full text of the article, please see our help page How do I view content?

Obtain permissions instantly via Rightslink by clicking on the button below:

If you are unable to obtain permissions via Rightslink, please complete and submit this Permissions form. For more information, please visit our Permissions help page.