Figures & data
Table 1 Effects of aldosterone and DMA on KW/BW, SBP, urinary excretion rate of protein, and serum creatinine in 5/6 nephrectomy rats at the 12th week
Figure 1. Photomicrographs of glomeruli (A–D). Glomerular proliferation was evaluated as described as E. In renal ablation rats, glomerular sclerosis was dramatically more serious than that of the SHAM group (B vs. A). Rats that received aldosterone infusion exhibited more serious glomerular sclerosis than the 5/6 nephrectomy rats (C vs. B). Treatment with DMA significantly attenuated aldosterone-induced glomerular injury (D). A: SHAM group; B: SNX group; C: ALDO group; D: ALDO+DMA group. *p < 0.01 versus SHAM group; **p < 0.01 versus SNX group; #p < 0.01 versus ALDO group. Magnification: ×400, PAS staining.
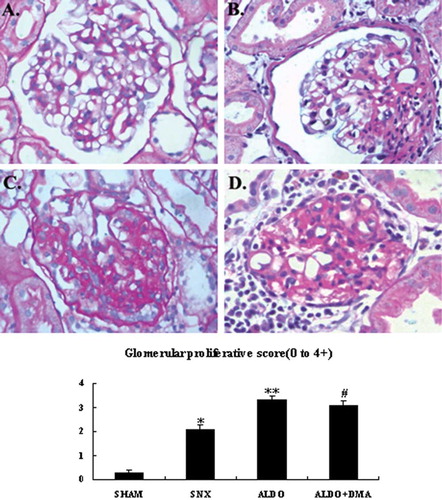
Figure 2. Photomicrographs of tubulointerstitium. Tubulointerstitial fibrosis and proteinaceous casts in tubuli were evaluated as described as E. In renal ablation rats, interstitial fibrosis and proteinaceous casts in tubuli was dramatically more serious than that of the SHAM group (B vs. A). Rats that received aldosterone infusion exhibited more serious interstitial fibrosis and proteinaceous casts in tubuli than the 5/6 nephrectomy rats (C vs. B). Treatment with DMA had no significant effect on the aldosterone-induced interstitial fibrosis and proteinaceous casts in tubuli (D). A: SHAM group; B: SNX group; C: ALDO group; D: ALDO+DMA group. *p < 0.01 versus SHAM group; **p < 0.05 versus SNX group. Magnification: ×400, Masson's trichrome.
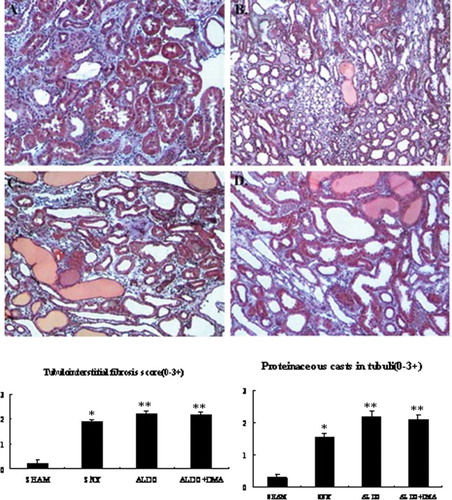
Figure 3. Representative photographs of immunohistochemistry for fibronectin. In renal ablation rats, fibronectin was observed slightly in the glomerular mesangium and the renal interstitium (B). However, in rats that received aldosterone infusion, renal injury was associated with increases in the numbers of fibronectin-positive (C and D) cells in the glomerular mesangium and the renal interstitium. There was no significant difference between aldosterone DMA-treated rats and the rats that were treated with aldosterone alone (C and D). A: SHAM group; B: SNX group; C: ALDO group; D: ALDO+DMA group. *p < 0.01 versus SHAM group; **p < 0.05 versus SNX group. Magnification: ×400.
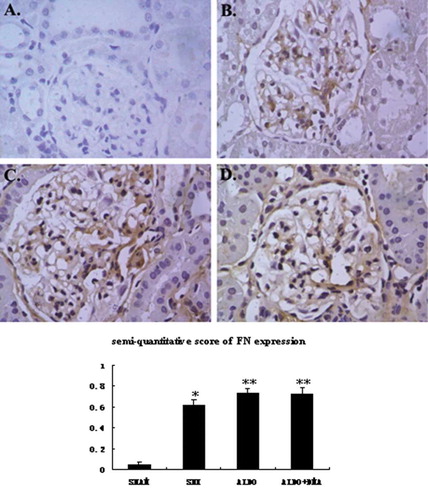
Figure 4. Representative photographs of immunohistochemistry for TGFβ1. In rats that received 5/6 nephrectomy, TGFβ1 was observed slightly in the glomerular mesangium and the renal interstitium (B). However, in rats that received aldosterone infusion, renal injury was associated with increases in the numbers of TGFβ1-positive (C and D) cells. The numbers of TGFβ1-positive cells seemed to be much less in aldosterone DMA-treated rats compared with rats that were treated with aldosterone alone (C and D). A: SHAM group; B: SNX group; C: ALDO group; D: ALDO+DMA group. *p < 0.01 versus SHAM group; **p < 0.05 versus SNX group; #p < 0.05 versus ALDO group. Magnification: ×400.
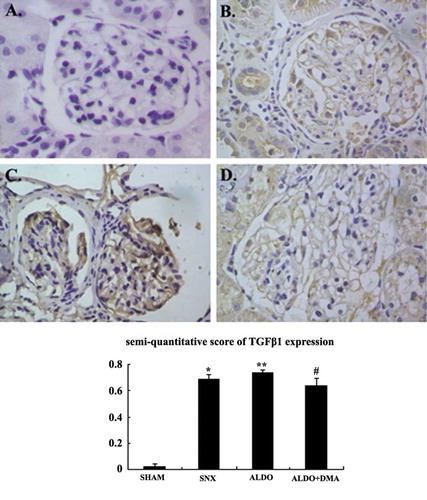
Figure 5. Representative photographs of immunohistochemistry for PCNA. In rats that received 5/6 nephrectomy, PCNA was expressed slightly higher in nuclei of the glomeruli and renal tubuli than that of the SHAM group rats (B and F). But in rats that received aldosterone infusion, cell proliferation was associated with dramatic increases in the numbers of PCNA-positive (C and G) cells. The numbers of PCNA-positive cells seemed to be much less in aldosterone and DMA–treated rats compared with rats that were treated with aldosterone alone (D and H). A and E: SHAM group; B and F: SNX group; C and G: ALDO group; D and H: ALDO+DMA group. *p < 0.01 versus SHAM group; **p < 0.05 versus SNX group; #p < 0.05 versus ALDO group. Magnification: A–D, ×200; E–H, ×400.
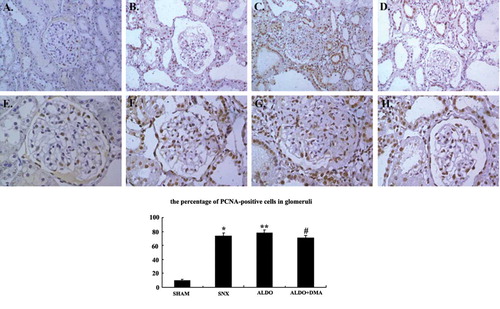
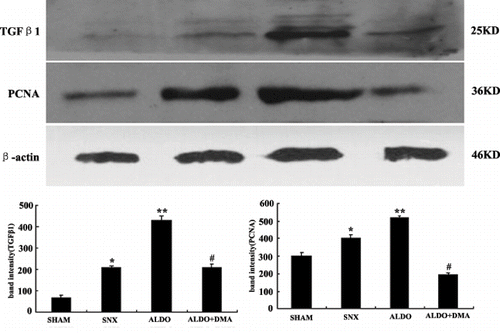
Figure 6. The expression of TGFβ1 and PCNA in renal cortical tissues by Western blot. TGFβ1 and PCNA in renal cortical tissues were markedly increased in rats that received aldosterone infusion, indicating ECM accumulation and cell proliferation in the kidney. The aldosterone-induced increase in renal cortical TGFβ1 and PCNA was prevented by treatment with DMA. Data are expressed as the relative differences between SNX rats and ALDO or ALDO+DMA treated rats after normalization to β-actin expression. *p < 0.01 versus SHAM group; **p < 0.01 versus SNX group; #p < 0.05 versus ALDO group.