Figures & data
FIGURE 1. Effect of mesenteric lymph duct ligation on renal function indices in shock rats (mean ± SD, n = 6).
FIGURE 2. Changes of pathomorphology of kidney in shock rats (HE staining, ×100): (A) sham group, (B) shock group, and (C) ligation group.
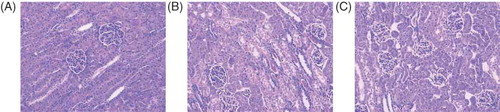
FIGURE 3. Effect of mesenteric lymph duct ligation on MDA content of kidney in hemorrhagic shock rats (mean ± SD, n = 6).
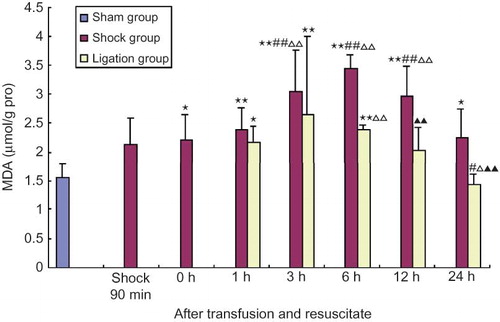
FIGURE 4. Effect of mesenteric lymph duct ligation on SOD activity of kidney in hemorrhagic shock rats (mean ± SD, n = 6).
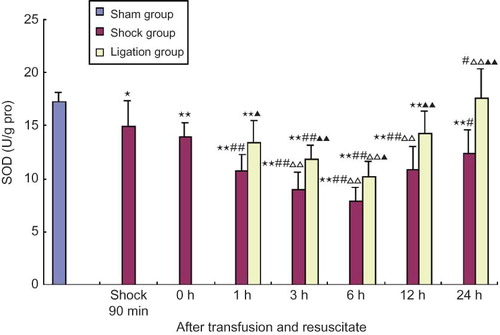
FIGURE 5. Effect of mesenteric lymph duct ligation on TNFα content of kidney in hemorrhagic shock rats (mean ± SD, n = 6).
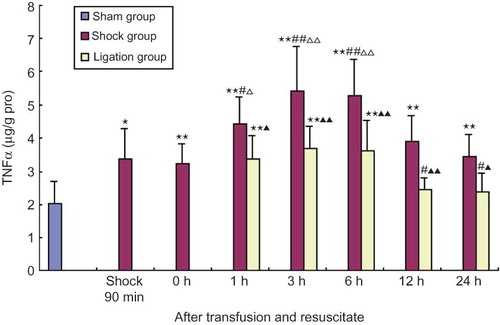
FIGURE 6. Effect of mesenteric lymph duct ligation on IL-6 content of kidney in hemorrhagic shock rats (mean ± SD, n = 6).
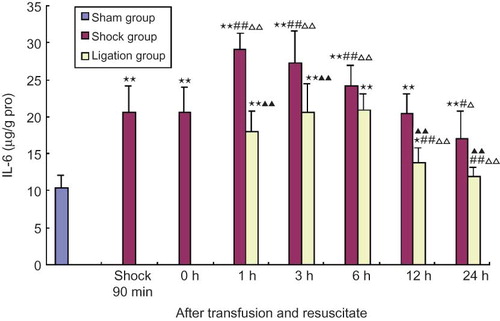
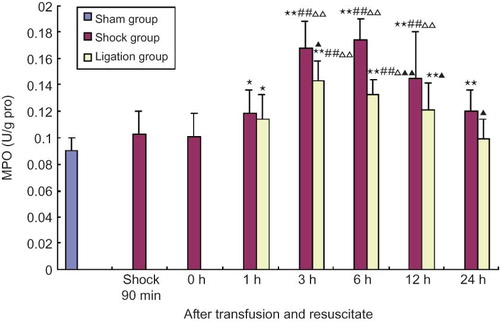
FIGURE 7. Effect of mesenteric lymph duct ligation on MPO activity of kidney in hemorrhagic shock rats (mean ± SD, n = 6).