Figures & data
FIGURE 1. Gross anatomy of kidney. (A) At 14d after UUO, kidney was significantly enlarged. (B) In sham group, renal cortex and medulla had clear boundary. (C) Kidneys in UUO group showed obvious thinning of renal parenchyma, dilated renal pelvis, and compressed papilla and flattened and blunt fornix papilla, some of which turned into concave shape.
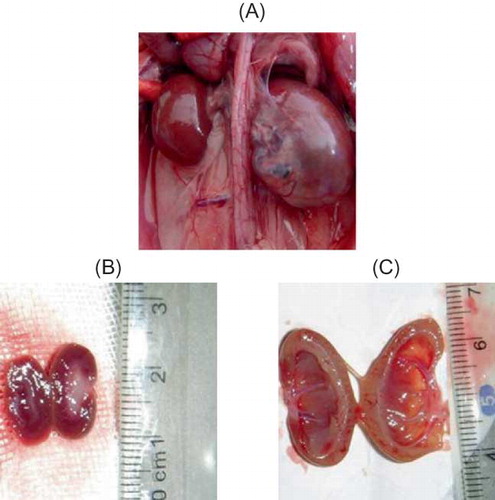
FIGURE 2. General pathological changes caused by UUO (HE staining). (A) No abnormal changes were detected in sham-operated rats. (B) At 3d after UUO, inflammatory cell infiltration and tubular edema appeared. (C) In UUO group, renal tubular dilation was observed at 7d after obstruction. Visible renal interstitial edema, monocyte and lymphocyte infiltration appeared at tubulointerstitial region. (D) In UUO group, renal tubular structure was severely damaged at 14d after obstruction, that is, collapsed lumen, diffusive infiltration of fibroblast in renal interstitium, and collagen formation. Original magnification ×400.
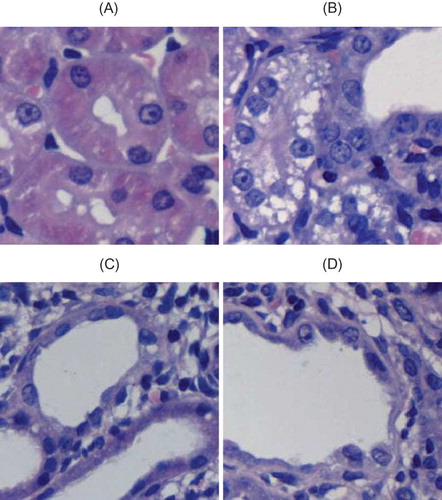
TABLE 1. Renal tubular damage score in each group (%, mean ± SEM, n = 10)
FIGURE 3. Collagen/fibrosis caused by UUO (Masson staining). (A) No abnormal changes were detected in sham-operated rats. (B) In UUO group, mild tubulointerstitial damage was noticed at 3d after obstruction. (C) At 7d after obstruction, UUO group showed renal interstitium widening and collagen deposition. (D) In UUO group, renal interstitial fibrosis significantly increased at 14d after obstruction, with increased extracellular matrix complexity and obvious collagen deposition. Original magnification × 400.
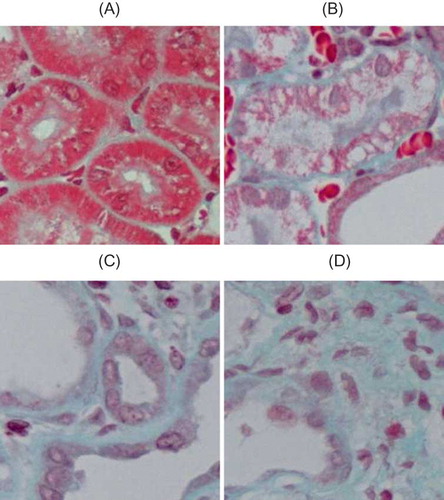
TABLE 2. Relative area of renal interstitium in each group (%, mean ± SEM, n = 10)
FIGURE 4. PAX2 protein expression in rat renal tissues. In renal cortex of sham group, no PAX2 expression was detected in renal tubular epithelial cells, PAX2 expression was detected in collecting duct epithelial cells (A). In renal medulla of sham group, relative abundant PAX2 expression was seen in collecting duct epithelial cells (B). At 3d after UUO, PAX2 expression appeared in renal tubular epithelial cells and collecting duct epithelial cells (C). At 14d after obstruction, PAX2 expression became more pronounced in renal tubular epithelial cells (D). At 14d after obstruction, PAX2 expression was detected in collecting duct epithelial cells of renal medulla (E). Original magnification ×400. In UUO group, average optical density of PAX2 protein significantly increased with prolonged obstruction (F).
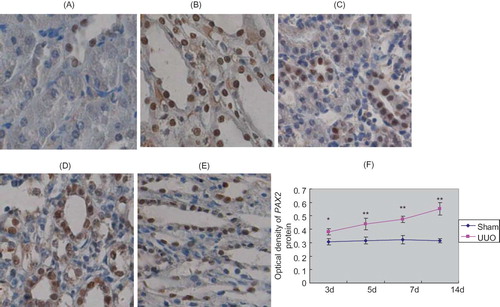
FIGURE 5. Western blotting analysis of PAX2 protein expression. (A) The expression of PAX2 and β-actin proteins in UUO and sham groups. (B) The ratio of PAX2 and β-actin proteins in UUO and sham groups.
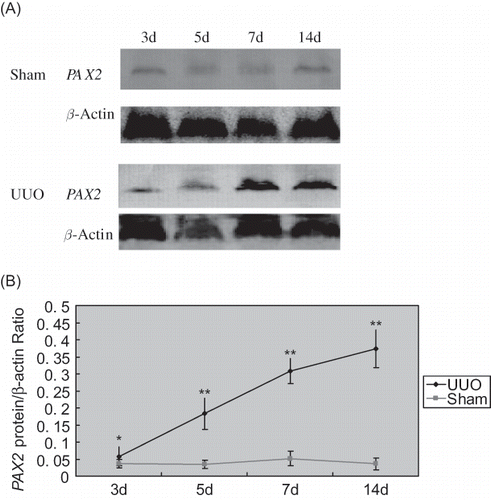
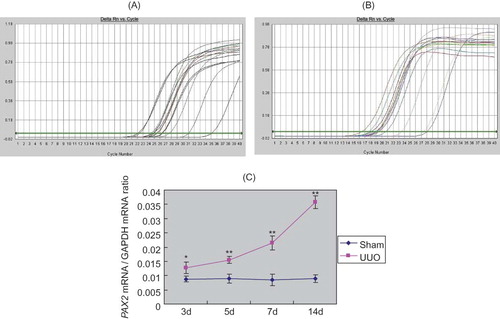
FIGURE 6. Real-time quantitative PCR analysis of PAX2 mRNA expression. (A) Amplification curve of PAX2. (B) Amplification curve of GAPDH. (C) With prolonged obstruction, the ratio of PAX2 mRNA/GAPDH mRNA significantly increased in UUO group.