876
Views
19
CrossRef citations to date
0
Altmetric
Laboratory Studies

Silymarin exacerbates p53-mediated tubular apoptosis in glycerol-induced acute kidney injury in rats

, &
Pages 623-632 | Received 17 Dec 2009, Accepted 07 Feb 2010, Published online: 20 May 2010

Figures & data

TABLE 1.  Renal function 24 h after glycerol injection

FIGURE 1. Serum creatinine phosphokinase (CK) level 6 h after glycerol injection. There was a significant increase in serum CK after glycerol injection. Silymarin administration had no significant influence on CK rise, which excludes any interference in the glycerol-induced rhabdomyolysis. n = 6 rats/group.
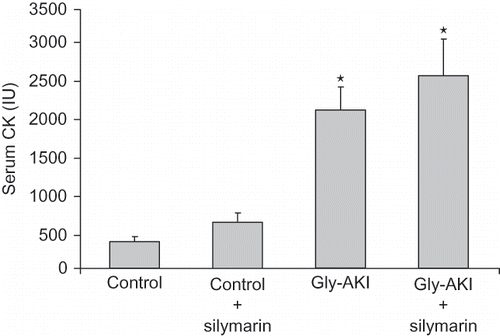
*p < 0.01 vs. controls.
FIGURE 1. Serum creatinine phosphokinase (CK) level 6 h after glycerol injection. There was a significant increase in serum CK after glycerol injection. Silymarin administration had no significant influence on CK rise, which excludes any interference in the glycerol-induced rhabdomyolysis. n = 6 rats/group.

FIGURE 2. Histological analysis of the renal tissue 24 h after glycerol injection. (A) Quantification of the number of cortical necrotic tubules/HPF showing 21.1 ± 2.8 (31% of the total number of tubules/HPF X400) and 19.2 ± 2.4 (28% of total number of tubules/HPF X400), respectively, in Gly-AKI and Gly-AKI + sily. Difference not significant: n = 8 (Gly-AKI) and 12 (Gly-AKI + sily). (B) TUNEL staining for the detection of apoptotic cells showing increased tubular apoptosis mainly in the outer medulla in Gly-ARF rats that was significantly accentuated by silymarin treatment. (C) Representative HE stained slide of the renal cortex from Gly-AKI rat, showing several totally denuded necrotic tubules. (D) Outer medulla field of a representative Gly-AKI + silymarin rat showing several apoptotic tubular cells lining the basement membrane (arrow) or desquamated into the tubular lumen (head arrow). n = 5–9/rats/group.
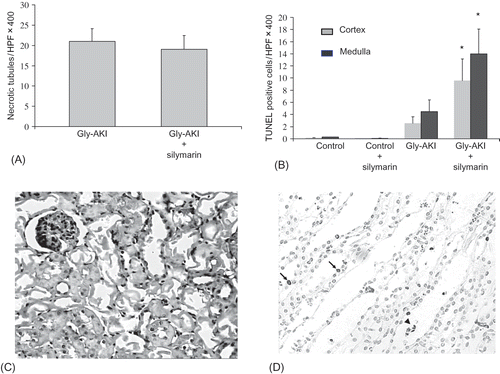
*p < 0.05 vs. others.
FIGURE 2. Histological analysis of the renal tissue 24 h after glycerol injection. (A) Quantification of the number of cortical necrotic tubules/HPF showing 21.1 ± 2.8 (31% of the total number of tubules/HPF X400) and 19.2 ± 2.4 (28% of total number of tubules/HPF X400), respectively, in Gly-AKI and Gly-AKI + sily. Difference not significant: n = 8 (Gly-AKI) and 12 (Gly-AKI + sily). (B) TUNEL staining for the detection of apoptotic cells showing increased tubular apoptosis mainly in the outer medulla in Gly-ARF rats that was significantly accentuated by silymarin treatment. (C) Representative HE stained slide of the renal cortex from Gly-AKI rat, showing several totally denuded necrotic tubules. (D) Outer medulla field of a representative Gly-AKI + silymarin rat showing several apoptotic tubular cells lining the basement membrane (arrow) or desquamated into the tubular lumen (head arrow). n = 5–9/rats/group.

FIGURE 3. Cleaved caspase-3 expression (immunohistochemistry) 24 h after glycerol injection. Positive cells showed nuclear staining and were more prevalent in Gly-AKI rats as compared with controls, predominated in outer medulla in relation to cortex and the expression was intensely exacerbated by silymarin treatment (darker nuclei). (A) Representative slide of the outer medulla of a health control rat, (B) Gly-AKI rat, (C) Gly-AKI rat treated with silymarin, and (D)quantification of positive caspase-3 cells/ HPF X400. n =5–6 rats/group.
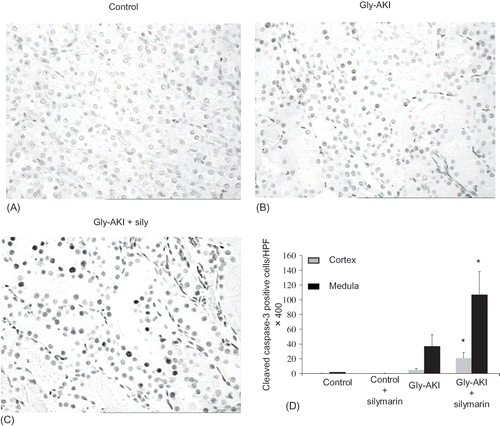
*p < 0.01 vs. others.
FIGURE 3. Cleaved caspase-3 expression (immunohistochemistry) 24 h after glycerol injection. Positive cells showed nuclear staining and were more prevalent in Gly-AKI rats as compared with controls, predominated in outer medulla in relation to cortex and the expression was intensely exacerbated by silymarin treatment (darker nuclei). (A) Representative slide of the outer medulla of a health control rat, (B) Gly-AKI rat, (C) Gly-AKI rat treated with silymarin, and (D)quantification of positive caspase-3 cells/ HPF X400. n =5–6 rats/group.

FIGURE 4. Correlation between cleaved caspase-3 positive and TUNEL positive tubular cells in Gly-AKI. Rats treated with silymarin (n = 4) or vehicle (n = 5). Each point represents mean of 10 cortical and 10 medullary HPF X400/rat. Correlation coefficient: 0.84, p < 0.01.
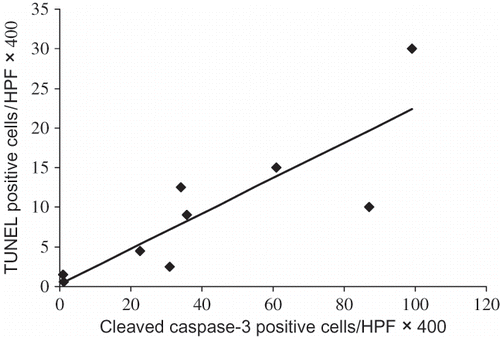
FIGURE 4. Correlation between cleaved caspase-3 positive and TUNEL positive tubular cells in Gly-AKI. Rats treated with silymarin (n = 4) or vehicle (n = 5). Each point represents mean of 10 cortical and 10 medullary HPF X400/rat. Correlation coefficient: 0.84, p < 0.01.

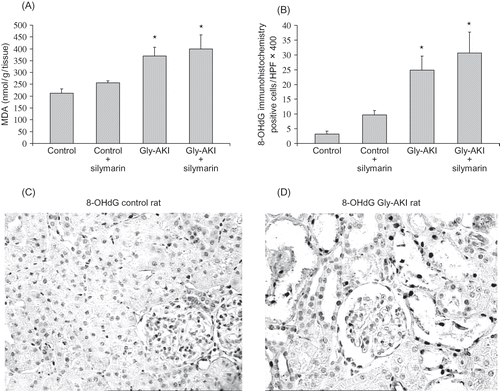
FIGURE 5. Renal tissue peroxidation after glycerol injection. (A) Gly-AKI rats showed increased level of cortical MDA 6 h after glycerol denoting increased lipid peroxidation. Silymarin treatment could not mitigate the lipid oxidative stress. n = 5–6 rats/group. (B) Similarly the DNA oxidative damage evaluated by 8-OHdG expression in the renal cortex 24 h after glycerol was increased in Gly-AKI rats and was not attenuated by silymarin treatment. (C) Representative slide of 8-OHdG immunohistochemistry in control and (D) Gly-AKI rat (X400). Note positive nuclei (darker) particularly in the more damaged cortical tubules. n = 6–7 rats/group.
*p < 0.05 vs. control groups.
FIGURE 5. Renal tissue peroxidation after glycerol injection. (A) Gly-AKI rats showed increased level of cortical MDA 6 h after glycerol denoting increased lipid peroxidation. Silymarin treatment could not mitigate the lipid oxidative stress. n = 5–6 rats/group. (B) Similarly the DNA oxidative damage evaluated by 8-OHdG expression in the renal cortex 24 h after glycerol was increased in Gly-AKI rats and was not attenuated by silymarin treatment. (C) Representative slide of 8-OHdG immunohistochemistry in control and (D) Gly-AKI rat (X400). Note positive nuclei (darker) particularly in the more damaged cortical tubules. n = 6–7 rats/group.

TABLE 2.  Leukocytes staining in the renal tissue (immunohistochemistry) 24 h after glycerol

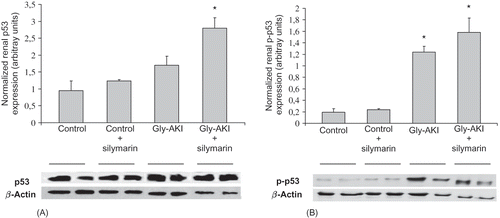
FIGURE 6. Renal expression of the p53 protein (Western blot) 6 h after glycerol injection. (A) There was strong expression of total p53 in all groups and it was significantly exacerbated in Gly-AKI rats treated with silymarin. (B) Phosphorylated p53 (p-p53) expression was very weak in controls and significantly enhanced in Gly-AKI rats. Each band corresponds to a distinct rat and 2 bands/group are shown that are representative of 2–4 rats/group. Densitometry analysis was normalized by β-actin hybridization.
*p < 0.05 vs. controls.
FIGURE 6. Renal expression of the p53 protein (Western blot) 6 h after glycerol injection. (A) There was strong expression of total p53 in all groups and it was significantly exacerbated in Gly-AKI rats treated with silymarin. (B) Phosphorylated p53 (p-p53) expression was very weak in controls and significantly enhanced in Gly-AKI rats. Each band corresponds to a distinct rat and 2 bands/group are shown that are representative of 2–4 rats/group. Densitometry analysis was normalized by β-actin hybridization.

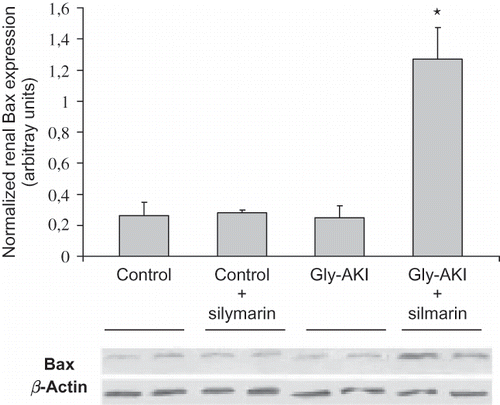
FIGURE 7. Renal expression of the Bax protein (Western blot) 6 h after glycerol injection. There was weak expression of the proapoptotic Bax protein in controls and Gly-AKI + vehicle. The Bax expression corrected by β-actin hybridization was significantly enhanced in Gly-AKI + silymarin rats. Each band corresponds to a distinct rat and 2 bands/group are shown that are representative of 2–4 rats/group.
*p < 0.05 vs. others.
FIGURE 7. Renal expression of the Bax protein (Western blot) 6 h after glycerol injection. There was weak expression of the proapoptotic Bax protein in controls and Gly-AKI + vehicle. The Bax expression corrected by β-actin hybridization was significantly enhanced in Gly-AKI + silymarin rats. Each band corresponds to a distinct rat and 2 bands/group are shown that are representative of 2–4 rats/group.
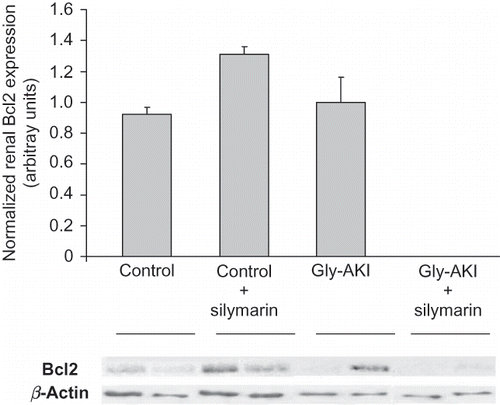
FIGURE 8. Renal expression of the Bcl-2 protein (Western blot) 6 h after glycerol injection. The expression of anti-apoptotic Bcl-2 protein was detected in controls and Gly-AKI + vehicle and was so tenuous in Gly-AKI + silymarin rats that could not be detected by the densitometry software. Each band corresponds to a distinct rat and 2 bands/group are shown that are representative of 2–4 rats/group.

FIGURE 8. Renal expression of the Bcl-2 protein (Western blot) 6 h after glycerol injection. The expression of anti-apoptotic Bcl-2 protein was detected in controls and Gly-AKI + vehicle and was so tenuous in Gly-AKI + silymarin rats that could not be detected by the densitometry software. Each band corresponds to a distinct rat and 2 bands/group are shown that are representative of 2–4 rats/group.

FIGURE 9. Renal expression of survivin (immunohistochemistry) 6 h after glycerol injection. The tubular expression analyzed through quantification of the number of cortical positive grid fields/HPF X400 was more intense in the deep cortex and outer medulla. Control rats showed stronger surviving expression than Gly-AKI. Silymarin treatment did not reduce survivin expression in Gly-AKI. n = 4–6 rat/group.
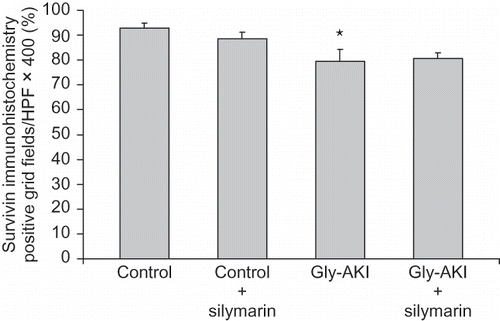
*p < 0.05 vs. control group.
FIGURE 9. Renal expression of survivin (immunohistochemistry) 6 h after glycerol injection. The tubular expression analyzed through quantification of the number of cortical positive grid fields/HPF X400 was more intense in the deep cortex and outer medulla. Control rats showed stronger surviving expression than Gly-AKI. Silymarin treatment did not reduce survivin expression in Gly-AKI. n = 4–6 rat/group.

Reprints and Corporate Permissions

Please note: Selecting permissions does not provide access to the full text of the article, please see our help page How do I view content?

To request a reprint or corporate permissions for this article, please click on the relevant link below:

Academic Permissions

Please note: Selecting permissions does not provide access to the full text of the article, please see our help page How do I view content?

Obtain permissions instantly via Rightslink by clicking on the button below:

If you are unable to obtain permissions via Rightslink, please complete and submit this Permissions form. For more information, please visit our Permissions help page.