Figures & data
FIGURE 1. OGT responses of nondiabetic rats (a and b) and STZ-induced diabetic (c and d) rats to graded doses of OA with respective untreated control or positive control animals. Values are presented as mean ± SEM (n = 6 in each group). ☆p < 0.05 by comparison with control animals.
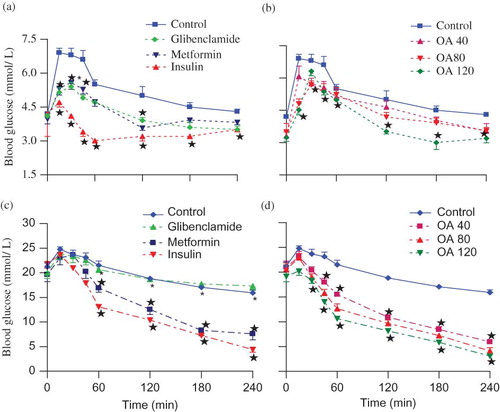
FIGURE 2. Comparison of OGT responses to OA alone and in combination with standard antidiabetic drugs in separate groups of nondiabetic rats (a and b) and STZ-induced diabetic (c and d) rats with respective control animals. Values are presented as means ± SEM (n = 6 in each group). ☆p < 0.05 by comparison with respective control animals.
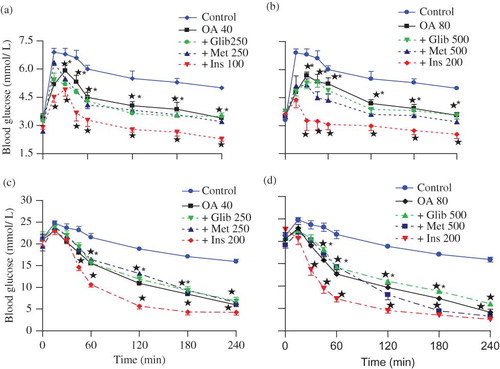
FIGURE 3. Comparison of acute (a and b) and short-term (c and d) effects of OA and standard antidiabetic drugs on plasma insulin and glucose concentrations in nondiabetic and STZ-induced diabetic rats with respective control groups. Blood samples were collected 60 min after glucose load. Values are presented as means ± SEM (n = 6 in each group). ☆p < 0.05 by comparison with respective control animals; #p < 0.05 by comparison with respective nondiabetic animals.
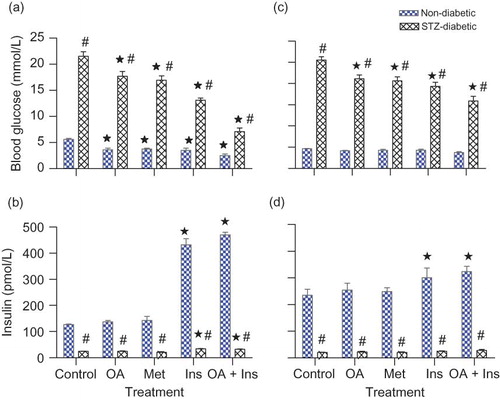
TABLE 1. Comparison of hepatic and muscle glycogen concentrations of various groups of nondiabetic and STZ-induced diabetic rats treated with OA and/or standard antidiabetic drugs with respective control groups