Figures & data
FIGURE 1. Mesenchymal stem cells (MSCs) were characterized by their canonical ability to differentiate into adipocytes and osteocytes. (a) MSCs on second passage growing in spindle-shaped morphology (rat MSCs ×100). (b) MSC cultured for 8 days with osteogenic supplements (von Kossa stain ×100). Osteogenic differentiation is shown by the formation of calcium-hydroxyapatite-positive area (von Kossa staining). (c) MSC cultured for 12 days with adipogenic supplements (Oil Red O stain ×100). Adipogenic differentiation is visualization by Oil Red O staining for intracellular lipid vacuoles.
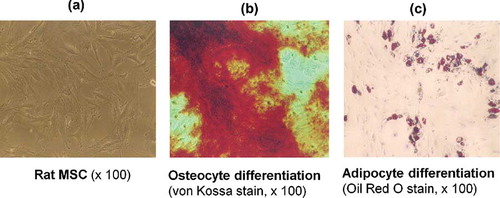
TABLE 1. Sequences of primers for real-time PCR
TABLE 2. Systolic blood pressure, urine volume, and urine protein excretion in studied animals
FIGURE 2. Renal histology in remnant kidney rats about glomerular sclerosis between the groups after 5 weeks. (a) Saline control group, (b) MCs control group, (c) once MSCs group, and (d) weekly MSCs group. Magnification ×100 (PAS staining). *p < 0.05 as compared with saline and MCs, **p < 0.05 as compared with once MSCs.
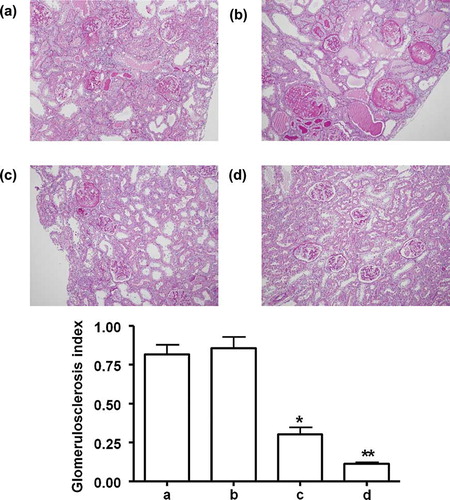
FIGURE 3. Renal histology in remnant kidney rats about glomerular and interstitial fibrosis between the groups after 5 weeks. (a) Saline control group, (b) MCs control group, (c) once MSCs group, and (d) weekly MSCs group. Magnification ×100 (Masson's Trichrome staining). *p < 0.05 as compared with saline and MCs, *p < 0.05 as compared with once MSCs.
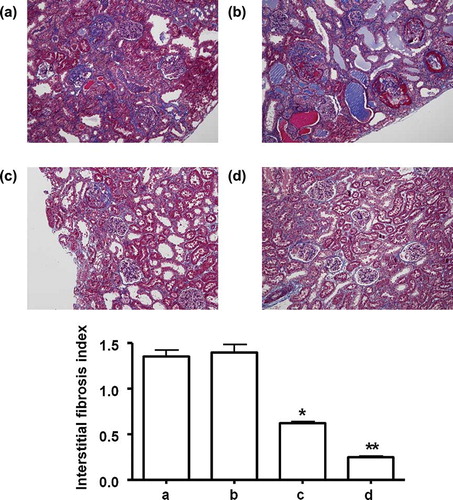
FIGURE 4. Infiltration of ED-1 positive cells between the groups after 5 weeks. (a) Saline control group, (b) MCs control group, (c) once MSCs group, and (d) weekly MSCs group. Magnification ×100 (Immunohistochemical staining with anti-ED-1 antibody). *p < 0.05 as compared with saline and MCs control. **p < 0.05 as compared with once MSCs.
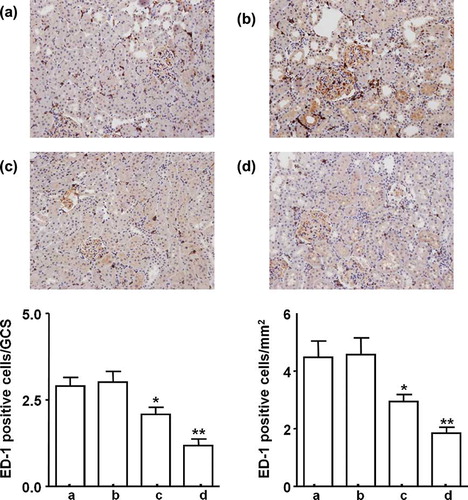
FIGURE 5. Cortical SRY gene expression of a male rat kidney: (a) positive control at 5 weeks, (b) weekly MSCs at 5 weeks, (c) once MSCs at 5 weeks, (d) MSCs at 1 week, and (e) once MCs at 1 week.
FIGURE 6. A fluorescence microscopy of MSC-labeled by CM-Dil: (a) weekly MSCs at 5 weeks, (b) once MSCs at 5 weeks, (c) MCs at 5 weeks, (d) once MSCs at 1 week, (e) MCs control at 1 week, and (f) saline control at 1 week.
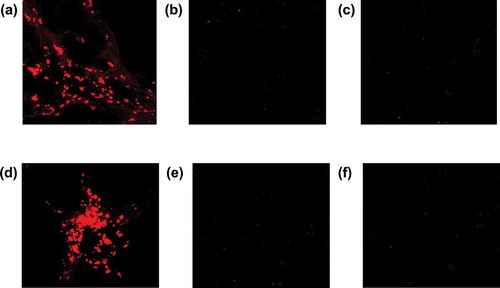
FIGURE 7. Relative mRNA expression of cytokines. (a) *p < 0.05 as compared with MCs control (1 week); and (b) *p < 0.05 as compared with once MSCs (5 weeks in each group).