Figures & data
TABLE 1. The sequences for specific PCR primer pairs and the different parameters for PCR amplification
FIGURE 1. Characterization of EPCs. (A) After 7 days in culture, attached cells exhibited a spindle-shaped endothelial cell-like morphology (original magnification × 200). (B, C, D) Adherent cells, lectin-binding (green), DiLDL uptake (red), double positive (orange) were assessed under a laser-scanning confocal microscope (original magnification × 400). The cells were further analyzed by immunofluorescence with (E) VEGFR-2, (F) CD34, and (G) CD133 antibodies (original magnification × 400).
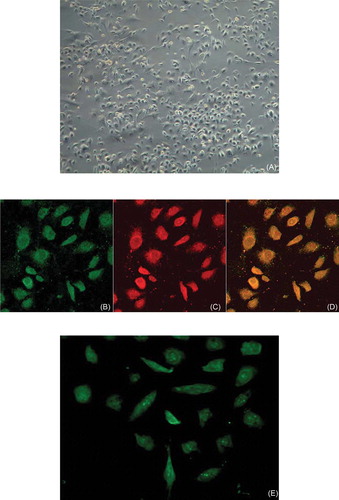
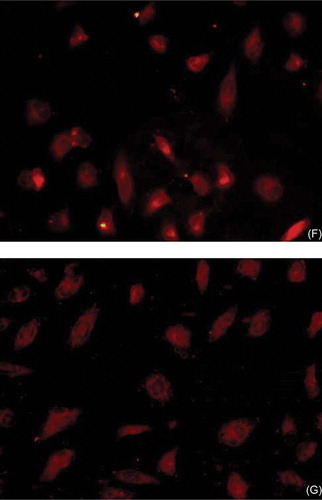
FIGURE 2. Effect of CM on EPCs proliferation. Hypoxic CM time-dependently increased the proliferation of EPCs. Proliferative activity of EPCs became apparent at 24 h and reached the maximum at 48 h; C (control group): conditioned medium from normoxic condition; CM: conditioned medium from hypoxic condition; A, light absorbance. Data are presented as the mean ± SD. n = 5. *p < 0.05, **p < 0.01 compared with control group 123 × 70 mm.
FIGURE 3. Effect of hypoxic CM on EPCs migration. CM time-dependently increased the migration of EPCs. Increase of EPCs migratory capacity became apparent after 6 h and reached the maximum at 12 h; C (control group): conditioned medium from normoxic condition; CM: conditioned medium from hypoxic condition; A, light absorbance. Data are presented as the mean ± SD. n = 5. *p < 0.05, **p < 0.01 compared with control group.
FIGURE 4. Effect of CM on VEGF protein expression. Production of VEGF protein by EPCs in CM group was significantly greater than that in control group and reached the maximum at 48 h. C (control group): conditioned medium from normoxic condition; CM: conditioned medium from hypoxic condition; β-actin was used as a housekeeping protein. Data are presented as the mean ± SD. n = 5. *p < 0.05 compared with control group.
FIGURE 5. Effect of CM on Ang-1 protein expression. Production of Ang-1 by EPCs in CM group was significantly greater than that in control group and became apparent and reached the maximum at 48 h. C (control group): conditioned medium from normoxic condition; CM: conditioned medium from hypoxic condition; β-actin was used as a housekeeping protein. Data are presented as the mean ± SD. n = 5. *p < 0.01 compared with control group.
FIGURE 6. Effect of CM on mRNA expression of CXCR4 production. RT-PCR: production of CXCR4 by EPCs in CM group was significantly greater than that in control group, and reached the maximum at 48 h. C (control group): conditioned medium from normoxic condition; CM: conditioned medium from hypoxic condition; β-actin was used as a housekeeping gene. Data are presented as the mean ± SD. n = 5. *p < 0.05, **p < 0.01 compared with control group.
FIGURE 7. SDF-1 expression in CM of cultured RTECs at different oxygen concentrations. SDF-1 expression of RTECs in hypoxic groups was significantly greater than that in control group and became apparent and reached the maximum with 5%O2 at 48 h. Data are presented as the mean ± SD. n = 5. *p < 0.05, **p < 0.01 compared with control group. C: control group (20% O2).
FIGURE 8. VEGF expression in CM of cultured RTECs at different oxygen concentrations. VEGF expression of RTECs in hypoxic groups was significantly greater than that in control group and became apparent and reached the maximum with 3% O2 at 48 h. Data are presented as the mean ± SD. n = 5. *p < 0.05, **p < 0.01 compared with control group. C: control group (20% O2).