Figures & data
TABLE 1. Primer sequences for real-time PCR analysis of Ang II/MAPK-pathways
FIGURE 1. Representative microscopy images of rat peritoneal mesothelial cells (RPMCs). (A) Typical cobblestone pattern in RPMCs at ×200 magnification; (B) typical microvilli on RPMC at ×4200 magnification; (C) immunofluorescent stain for keratin at ×400; and (D) immunofluorescent stain for vimentin at ×400. The representative pictures are shown here.
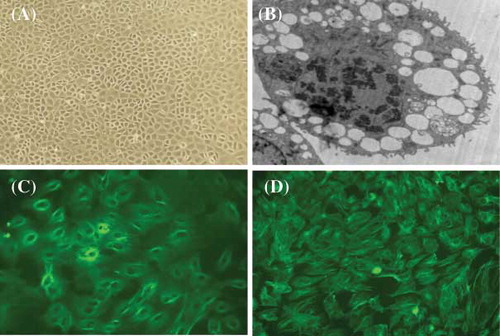
FIGURE 2. Time- and dose-dependent upregulation of TGF-β1 in RPMCs after exposure to Ang II. (A) Concentration-dependent increase of TGF-β mRNA and protein levels following RPMC incubation for 24 h with various concentrations of Ang II. *p < 0.05 compared with Ang II absent group. (B) Concentration-dependent increase of TGF-β secretion following RPMC incubation for 24 h with various concentrations of Ang II and measured using ELISA. *p < 0.05 compared with Ang II absent group; #p < 0.01 compared with Ang II absent group. (C) Time-dependent increase of TGF-β secretion following RPMC incubation with 1 nmol/L of Ang II for various time intervals and measured by ELISA. *p < 0.05 compared with 0 h group; #p < 0.01 compared with 0 h group. Reported p-values indicate significant differences versus control group (only vehicle and no incubation time). Immunoblots are the representative pictures of three independent experiments.
FIGURE 3. Dose-dependent increase in (A) fibronectin, (B) TIMP, and (C) PAI-1 mRNA and protein levels in RPMCs after incubation with various concentrations of Ang II for 24 h. (A) Dose-dependent increase of fibronectin mRNA and protein levels in RPMC after incubation with various concentrations of Ang II for 24 h. (B) Dose-dependent increase of TIMP mRNA levels in RPMC after incubation with various concentrations of Ang II for 24 h. (C) Dose-dependent increase of PAI-1mRNA levels in RPMC after incubation with various concentrations of Ang II for 24 h. Immunoblots are representative pictures of three independent experiments. *p < 0.05 compared with Ang II absent group.
FIGURE 4. Dose-dependent upregulation of ERK/p38/JNK phosphorylation in RPMCs stimulated with Ang II in the absence or presence of Ang II antagonists. (A) ERK1/2 phosphorylation rose after 60 min stimulation with 1 μmol/L of Ang II, but was inhibited by the addition of either the antagonists losartan (10-5 mol/L; AL) or PD98059 (20 μmol/L; APD). (B) P38 phosphorylation rose after 60 min stimulation with 1 μmol/L of Ang II (A), but was inhibited by the addition of SB203580 (20 μmol/L; ASB). (C) ERK1/2 phosphorylation rose time-dependently following incubation with 1 μmol/L of Ang II and peaked at 10 min, while total ERK1/2 remained unchanged. (D) JNK phosphorylation did not change after 60 min stimulation with 1 μmol/L of Ang II (A), but baseline phosphorylation was inhibited by the addition of SP600125 (20 μmol/L; ASP). All above immunoblots are representative pictures of at least three independent experiments. *p < 0.05 compared with N group(A,B,D) or 0 min group(C); #p < 0.05 compared with A group.
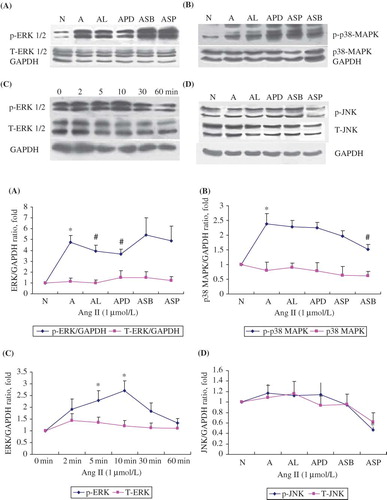
FIGURE 5. Fibronectin mRNA and protein rose after 60 min stimulation with 1 μmol/L of Ang II (A), but was inhibited by the addition of the AT1 antagonists losartan (10−5 mol/L; AL), the ERK antagonist PD98059 (20 μmol/L; APD), but not with the p38 MAPK inhibitor SB203580 (20 μmol/L; ASB) or the JNK inhibitor SP600125 (20 μmol/L; ASP). Immunoblots are representative pictures of three independent experiments. *p < 0.05 compared with N group; #p < 0.05 compared with A group.