Figures & data
Figure 1. (A)–(C) show macroscopic measurements that were made on the kidneys.Note: UT, upper top; BT, bottom top; M, median line; SML, superior–midline length; IML, inferior–midline length; L, length; TAPD, top anterior–posterior depth; MAPD, middle anterior–posterior depth; BAPD, bottom anterior–posterior depth; a and b show fluid displacement for volume measurements of kidney.
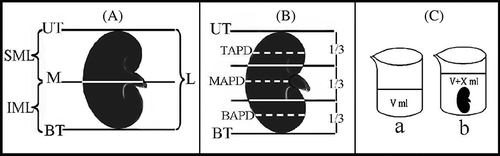
Figure 2. (A) Sampling strategy that is used at the section level; (B) (I) reference and (II) look-up sections of the dissector pair are seen. The distance between them is 30 µm. These pairs are used for the estimation of both the number and height of glomeruli. Long arrows show glomeruli that are seen at both the reference and look-up sections; short black arrows point to dissector glomeruli that are observed in the reference section but not in the look-up section (white short arrow in B). Dp is a dissector pair. Scale bar is 500 µm.
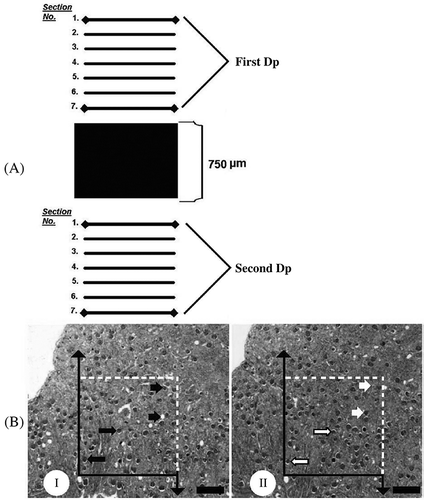
Figure 3. (A) (I, II) Illustration of section area fraction strategy. On average, 12–14 section pairs were obtained at section level and divided into approximately 90 equal areas. (B) (I, II) An illustration of area fraction strategy. Unbiased counting frames were put on images. (C) (I, II) Micrographs of a dissector pair are seen that are used for estimating the number and height of a glomerulus.
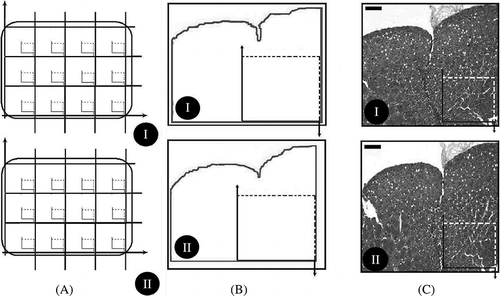
Table 1. Data belong to the dimensions, weight, and volumes of right and left kidneys (mean ± SEM)
Figure 4. Glomerulus density in kidneys for normal and anencephalic fetuses (mean ± SEM).
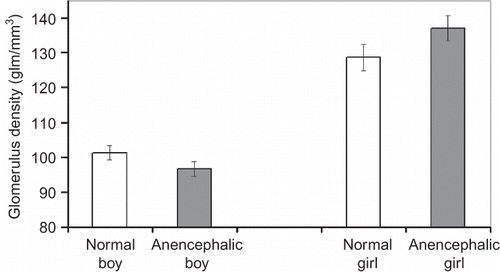
Figure 5. Glomerulus number in kidneys for normal and anencephalic fetuses (mean ± SEM).
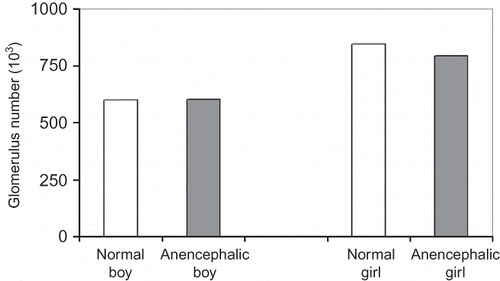
Figure 6. Glomerulus height in kidneys for normal and anencephalic fetuses (mean ± SEM).
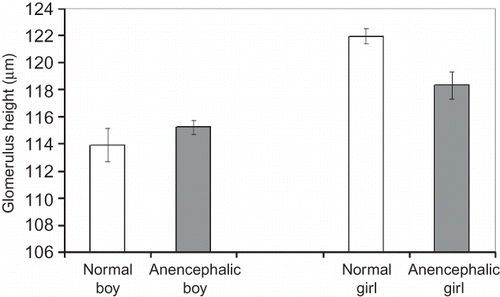
Figure 7. Kidney volume estimation using Cavalieri principle for normal and anencephalic fetuses (mean ± SEM).
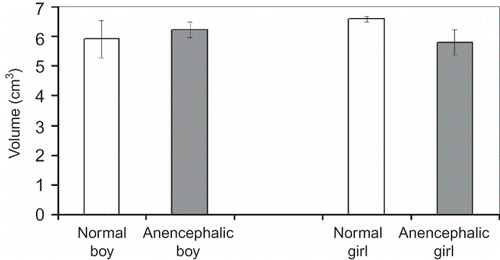
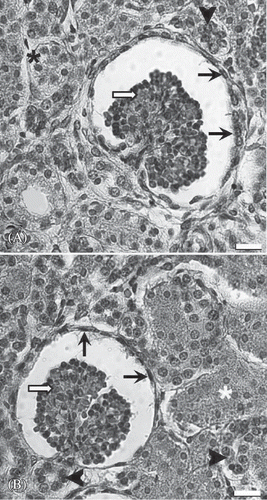
Figure 8. Representative light micrographs of renal cortex from a normal fetus (A) and an anencephalic fetus (B). The structure of the anencephalic kidney does not show a significant difference from the normal kidney. Arrow head, distal tubule; asterisk, proximal tubule; white arrow, glomerulus; black arrow, visceral sheet of Bowman capsule. Scale bar is 40 µm.