Figures & data
Table 1. Serum creatinine and blood urea nitrogen level.
Figure 1. Pathological findings in 5/6 nephrectomized rats (periodic acid-Schiff (PAS) staining and Masson staining). (A1–A3) Sham group (PAS staining). (B1–B3) 5/6 nephrectomized group (PAS staining). (A4–A6) Sham group (Masson staining). (B4–B6) 5/6 nephrectomized group (Masson staining). The arrow points indicate glomerular sclerosis, inflammatory cell infiltration of the interstitium, protein casts, tubular atrophy, and interstitial fibrosis.
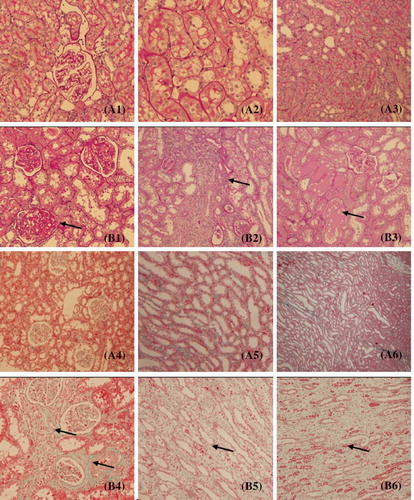
Figure 2. Expression of E-cadherin in kidney frozen sections and tissues. (A) The localization of E-cadherin in frozen sections was determined by IF (200×) with E-cadherin antibody (red). (B) Western blot analysis of E-cadherin in kidney tissues. Lanes 1 and 2 are sham operation group and lanes 3 and 4 are 5/6Nx group. (C) E-cadherin protein levels. Data were expressed versus β-actin and compared with ANOVA.
Note: *Denotes p < 0.05 versus sham operation group.
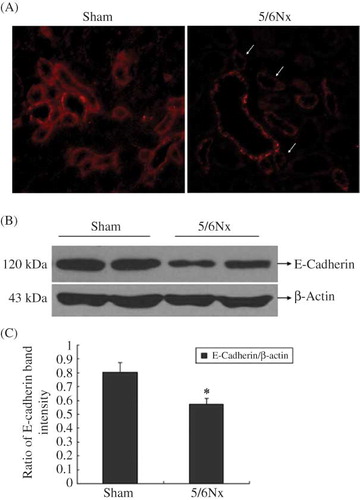
Figure 3. Morphological assessment of HK-2 cells. (A) 10% FBS group (100×); (B) 10% sham serum group (100×); (C) 10% 5/6 nephrectomized rat serum group (100×).
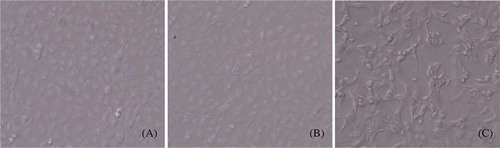
Table 2. Effect of 5/6 nephrectomized rat serum on morphology of HK-2 cells (length/width ratio).
Figure 4. Expression of E-cadherin, vimentin, and fibronectin protein in cultured cells. The localization of E-cadherin, vimentin, and fibronectin was determined by IF (400×) with E-cadherin antibody (red) (A1–A3), vimentin antibody (green) (B1–B3), and fibronectin antibody (red) (C1–C3).
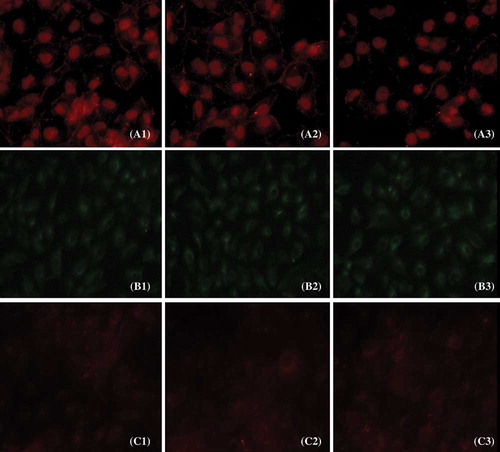
Figure 5. Expression of E-cadherin, vimentin, and fibronectin in HK-2 cells. (A) Western blot of E-cadherin, vimentin, and fibronectin. Lanes 1–3 are 10% FBS group, 10% sham operation serum group, and 10% 5/6 nephrectomized rat serum group, respectively. (B) E-cadherin, vimentin, and fibronectin protein levels. Data were expressed versus β-actin and compared with ANOVA.
Notes: The experiment was repeated three times with similar results.
*Denotes p < 0.05 versus 10% sham operation serum group.
Figure 6. E-Cadherin, vimentin, and fibronectin mRNA in HK-2 cells. (A) Total RNA isolated from rats at different ages was analyzed with RT-PCR. Lanes 1–4 are marker (DL2000), 10% FBS group, 10% sham operation serum group, and 10% 5/6 nephrectomized rat serum group, respectively. (B) Expression analysis of E-cadherin, vimentin, and fibronectin mRNA abundance with ANOVA.
Notes: The experiment was repeated three times with similar results.
*Denotes p < 0.05 versus 10% sham operation serum group.
Figure 7. Expression of E-cadherin at different time points of HK-2 cells. (A) Western blot analysis of E-cadherin in cultured cells at different time points. (B) E-Cadherin protein levels. Data were expressed versus β-actin and compared with ANOVA.
*Denotes p < 0.05 versus sham operation serum group.
Figure 8. Expression of wnt3, β-catenin, and ZEB1 in HK-2 cells. (A) Western blot analysis of wnt3, β-catenin, and ZEB1. Lanes 1–3 are 10% FBS group, 10% sham operation serum group, and 10% 5/6 nephrectomized rat serum group, respectively. (B) wnt3, β-catenin, and ZEB1 protein levels. Data were expressed versus β-actin and compared with ANOVA.
Notes: The experiment was repeated three times with similar results.
*Denotes p < 0.05 versus 10% sham operation serum group.