488
Views
2
CrossRef citations to date
0
Altmetric
Clinical Study

A Transient Improvement in Renal Function Occurs after Ischemic Stroke

, , , , , & show all
Pages 7-12 | Received 29 Apr 2011, Accepted 11 Sep 2011, Published online: 25 Oct 2011

Figures & data

Table 1. Medical history of subjects admitted with ischemic stroke (n = 220).

Table 2. Data of subjects with ischemic stroke and normal (≤1.2 mg/dL) or elevated (>1.2 mg/dL) serum creatinine at admission.

Figure 1. Serum creatinine in patients with ischemic stroke and elevated (>1.2 mg/dL, squares, n = 62) or normal creatinine (≤1.2 mg/dL, circles, n = 158) after admission. Data are presented as means ± SEM. Note: *Denotes p < 0.001 versus baseline, ANOVA and Fisher LSD.

Figure 1. Serum creatinine in patients with ischemic stroke and elevated (>1.2 mg/dL, squares, n = 62) or normal creatinine (≤1.2 mg/dL, circles, n = 158) after admission. Data are presented as means ± SEM. Note: *Denotes p < 0.001 versus baseline, ANOVA and Fisher LSD.

Figure 2. Maximum changes in serum creatinine (Δ-creatinine) after admission for ischemic stroke in patients with elevated (>1.2 mg/dL, gray bars) or normal creatinine (≤1.2 mg/dL, black bars). Obtained from male and female subjects, patients with and without diabetes mellitus (DM), and patients with and without heart failure (HF). Data are presented as means ± SEM.

Figure 2. Maximum changes in serum creatinine (Δ-creatinine) after admission for ischemic stroke in patients with elevated (>1.2 mg/dL, gray bars) or normal creatinine (≤1.2 mg/dL, black bars). Obtained from male and female subjects, patients with and without diabetes mellitus (DM), and patients with and without heart failure (HF). Data are presented as means ± SEM.

Table 3. Comparison of subgroups to assess the effect of diabetes and heart failure (HF) on the creatinine course stratified according to elevated or normal creatinine (ANOVA and Fisher LSD post hoc test).

Figure 3. Serum creatinine of patients (A) with or without diabetes and (B) with or without heart failure. Data are presented as means ± SEM. Note: *Denotes p < 0.05 versus baseline, ANOVA and Fisher LSD.

Figure 3. Serum creatinine of patients (A) with or without diabetes and (B) with or without heart failure. Data are presented as means ± SEM. Note: *Denotes p < 0.05 versus baseline, ANOVA and Fisher LSD.

Figure 4. Creatinine course in (A) men and (B) women with ischemic stroke and elevated (>1.2 mg/dL, squares) or normal creatinine (≤1.2 mg/dL, circles). Data are presented as means ± SEM. Note: *Denotes p < 0.01 versus baseline, ANOVA and Fisher LSD.
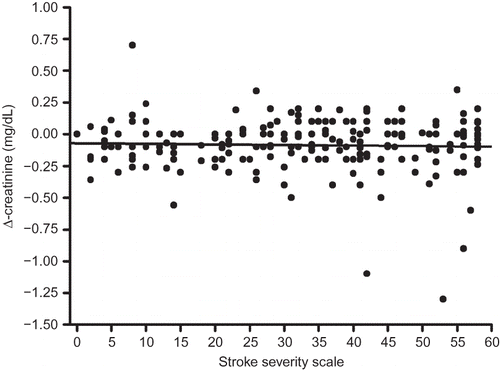
Figure 4. Creatinine course in (A) men and (B) women with ischemic stroke and elevated (>1.2 mg/dL, squares) or normal creatinine (≤1.2 mg/dL, circles). Data are presented as means ± SEM. Note: *Denotes p < 0.01 versus baseline, ANOVA and Fisher LSD.

Figure 5. Relationship between individual maximum serum creatinine change and stroke severity scale in 220 patients with ischemic stroke (p = 0.487; r = 0.048, Spearman correlation).

Figure 5. Relationship between individual maximum serum creatinine change and stroke severity scale in 220 patients with ischemic stroke (p = 0.487; r = 0.048, Spearman correlation).

Reprints and Corporate Permissions

Please note: Selecting permissions does not provide access to the full text of the article, please see our help page How do I view content?

To request a reprint or corporate permissions for this article, please click on the relevant link below:

Academic Permissions

Please note: Selecting permissions does not provide access to the full text of the article, please see our help page How do I view content?

Obtain permissions instantly via Rightslink by clicking on the button below:

If you are unable to obtain permissions via Rightslink, please complete and submit this Permissions form. For more information, please visit our Permissions help page.