1,603
Views
53
CrossRef citations to date
0
Altmetric
Laboratory Study

Quercetin Ameliorates Diabetic Nephropathy by Reducing the Expressions of Transforming Growth Factor-β1 and Connective Tissue Growth Factor in Streptozotocin-Induced Diabetic Rats

, &
Pages 83-87 | Received 11 Jun 2011, Accepted 04 Sep 2011, Published online: 20 Oct 2011

Figures & data

Table 1. Metabolic and renal parameters of the three groups.

Figure 1. Gene expressions of transforming growth factor-β1 (TGF-β1) and connective tissue growth factor (CTGF) were quantified by real-time PCR in the renal tissues of three groups (n = 8). Data are presented as fold change of transcripts for target gene in indicated groups normalized to GAPDH.

Note: ap < 0.01 for differences versus control group; bp < 0.01 for differences versus diabetic group.
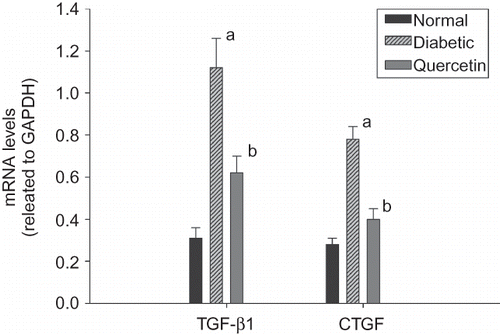
Figure 1. Gene expressions of transforming growth factor-β1 (TGF-β1) and connective tissue growth factor (CTGF) were quantified by real-time PCR in the renal tissues of three groups (n = 8). Data are presented as fold change of transcripts for target gene in indicated groups normalized to GAPDH.Note: ap < 0.01 for differences versus control group; bp < 0.01 for differences versus diabetic group.

Figure 2. (A) Representative Western blots showing transforming growth factor-β1 (TGF-β1), connective tissue growth factor (CTGF), and β-actin protein levels in the renal tissues of three groups. (B) Quantification of protein levels using TGF-β1/β-actin and CTGF/β-actin was expressed as mean ± SD (n = 12 per group) in each column.

Note: ap < 0.01 compared with the values of control rats; bp < 0.01 compared with the values of untreated diabetic rats.
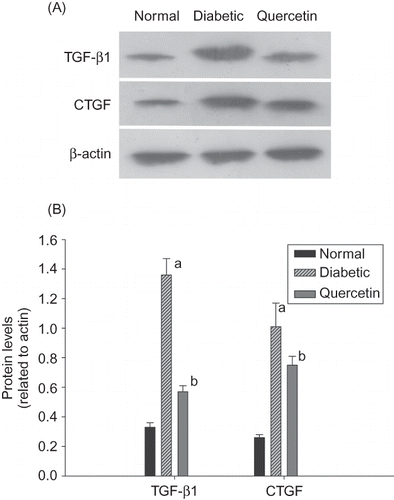
Figure 2. (A) Representative Western blots showing transforming growth factor-β1 (TGF-β1), connective tissue growth factor (CTGF), and β-actin protein levels in the renal tissues of three groups. (B) Quantification of protein levels using TGF-β1/β-actin and CTGF/β-actin was expressed as mean ± SD (n = 12 per group) in each column.Note: ap < 0.01 compared with the values of control rats; bp < 0.01 compared with the values of untreated diabetic rats.

Reprints and Corporate Permissions

Please note: Selecting permissions does not provide access to the full text of the article, please see our help page How do I view content?

To request a reprint or corporate permissions for this article, please click on the relevant link below:

Academic Permissions

Please note: Selecting permissions does not provide access to the full text of the article, please see our help page How do I view content?

Obtain permissions instantly via Rightslink by clicking on the button below:

If you are unable to obtain permissions via Rightslink, please complete and submit this Permissions form. For more information, please visit our Permissions help page.