Figures & data
Figure 1. A 79-year-old female patient. Axial computed tomography (CT) image (A). Sagittal oblique (B) and coronal oblique (C) images reformatted according to pole-to-pole length (R1) of left kidney. R1 was measured as 101 mm.
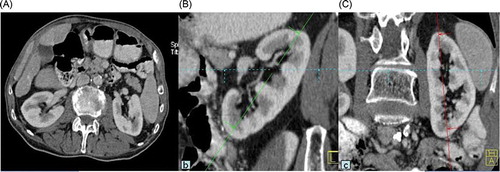
Figure 2. Axial computed tomography (CT) image obtained via pan zooming to kidney; distance up to lateral margin from the level of renal hilus (R2) and bicortical length perpendicular to R2 (R3).
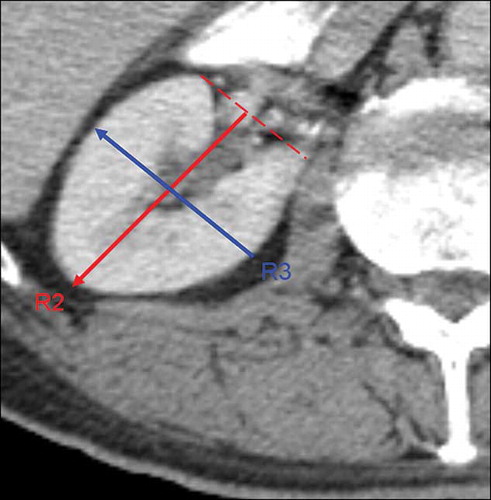
Table 1. General characteristics and renal dimensions of the entire study population [mean ± SD (percentage)].
Figure 3. Scatter plot graph showing relationship of Cockcroft–Gault (CG)-estimated glomerular filtration rate (eGFR) with increasing age. There is a negative correlation between CG-eGFR and age.
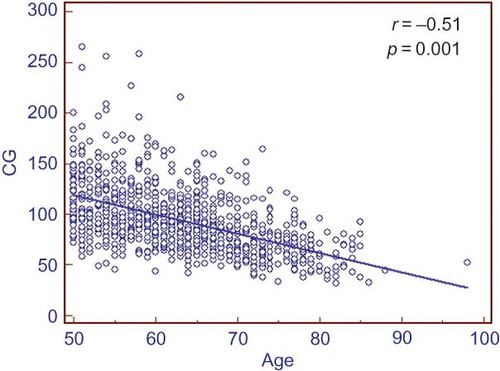
Figure 4. Scatter plot graph showing relationship of R1 size with Cockcroft–Gault (CG)-estimated glomerular filtration rate (eGFR). There is a positive correlation between R1 and CG-eGFR.
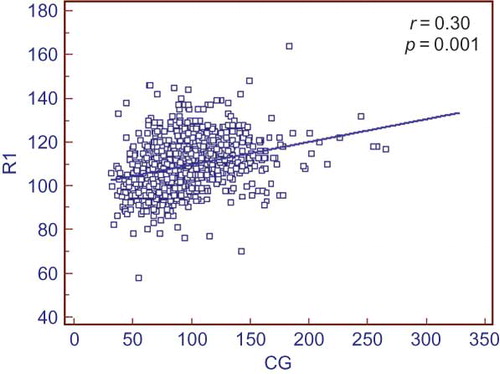
Table 2. Correlations between age, height, weight, serum urea, creatinine, CG-GFR, and MDRD-GFR with renal dimensions (Pearson’s correlation).
Table 3. Logistic regression model (enter method) showing independent relationship of some variables with renal dimensions RPW, R1, R2, and R3.
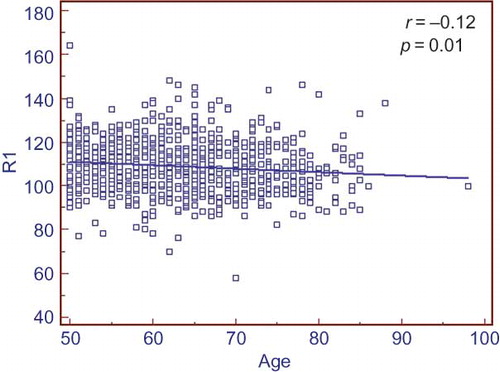
Figure 5. Scatter plot graph showing relationship of age with R1 size. There is a weak negative correlation between R1 and age.