Figures & data
Table 1. Changes in Scr and Ccr in Nx and sham-operated rats.
Table 2. Comparison of serum P, iCa, and iPTH in different rat groups.
Figure 1. Comparison of calcium–phosphorus product in HP + Renagel versus Nx + HP rats.
Notes: All results were from three independent experiments, and analysis was done by a core service center in a double-blinded manner. Data are presented as mean ± SD. *Denotes p < 0.05 versus Nx + HP group.
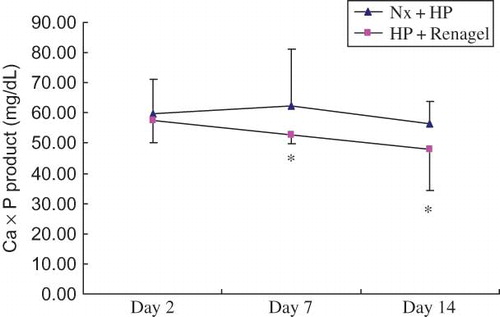
Figure 2. Urinary FEP in different rat groups.
Notes: All results were from three independent experiments, and analysis was done by a core service center in a double-blinded manner. Data are presented as mean ± SD. *Significantly different from Sham + HP group at p < 0.05, **significantly different from Nx + HP group at p < 0.05, and ***significantly different from Nx + HP group at p < 0.05.
Figure 3. NaPi-2 mRNA expression in different rat groups. (A) Expression of NaPi-2 mRNA by RT-PCR. PCR products were separated in 1% agarose gel and stained with ethidium bromide. (B) Densitometric data of renal NaPi-2 mRNA abundance. NaPi-2 mRNA signals were quantified by image analysis software BandScan 4.3. Data were expressed versus GAPDH and compared with ANOVA.
Notes: All results were from three independent experiments, and analysis was done by a core service center in a double-blinded manner. *Significantly different from Sham + LP group at p < 0.05, **significantly different from Nx + LP group at p < 0.01, and ***significantly different from Nx + HP group at p < 0.01.