Figures & data
Table 1. Comparison of basal characteristics and study results between survival and death groups.
Table 2. Comparison of basal characteristics and study results between normal and cardiovascular event groups.
Table 3. Comparison of basal characteristics and study results between normal and low T3 groups.
Figure 1. Linear regression analysis of age, renal function, and proteinuria affecting serum thyroid hormone level. (A) T3 and age. (B) T3 and serum albumin. (C) Free T4 (fT4) and 24 h urine protein. (D) fT4 and serum creatinine.
Figure 2. Cause of death of all patients during 36 months.
Note: GI, gastrointestinal.
Figure 3. Kaplan–Meier survival curve during 36 months. (A) Cumulative survival rate (p = 0.000). (B) Cardiovascular event (p = 0.013). (C) Cardiovascular mortality (p = 0.001).
Table 4. Cox regression analysis of factors affecting cardiovascular events and GFR_MDRD.
Table 5. Cox regression analysis of factors affecting cardiovascular mortality.
Table 6. Cox regression analysis of factors affecting all-cause mortality.
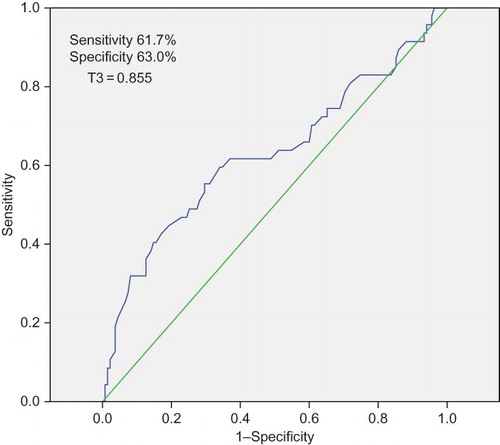
Figure 4. The receiver operating characteristic (ROC) curve of T3 and all-cause mortality (T3 = 0.855; sensitivity, 61.7%; specificity, 63.0%).