Figures & data
Table 1. Patients’ baseline characteristics (N = 43).
Figure 1. Changes in the consulting room blood pressure of the 150 mg/day group (A) and the 300 mg/day group (B).
Note: *Significant according to the results of a one-way ANOVA (p = 0.0045) and Tukey’s multiple comparison testing (0 vs. 5, 0 vs. 6).
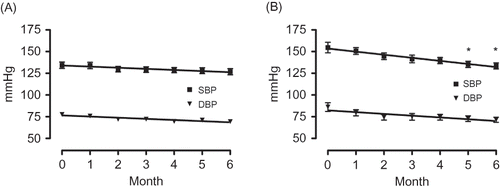
Figure 2. Changes in the consulting room blood pressure of the high eGFR group (A) and the low eGFR group (B).
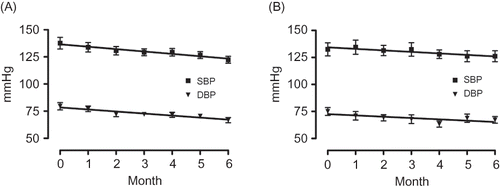
Figure 3. Effect of aliskiren on urinary protein.
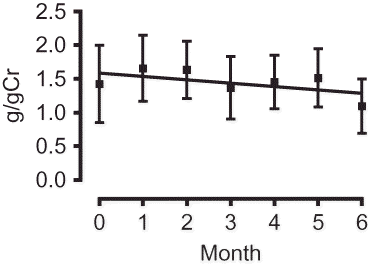
Figure 4. Comparison of gradient of the regression lines of urinary protein values before administration (−6 to 0 months; left panel) and after administration (0 to 6 months; right panel).
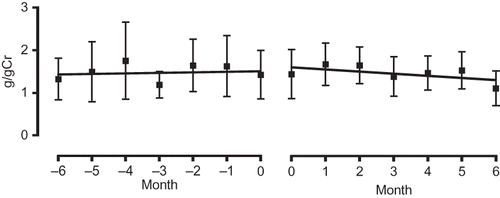
Figure 5. Changes in the serum Cr level of the high eGFR group (A) and the low eGFR group (B).
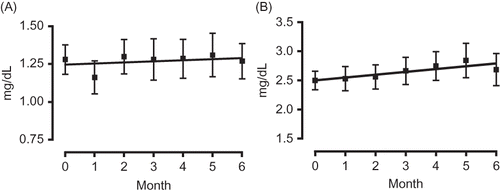
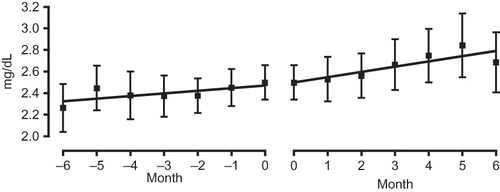
Figure 6. Comparison of gradient of the regression lines of the serum Cr level of the high eGFR group before administration (−6 to 0 months; left panel) and after administration (0–6 months; right panel).
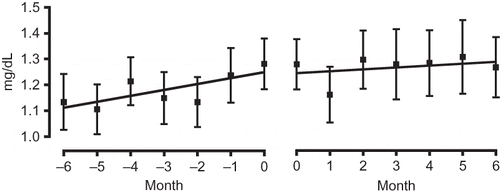
Figure 7. Comparison of gradient of the regression lines of the serum Cr level of the low eGFR group before administration (−6 to 0 months; left panel) and after administration (0 to 6 months; right panel).