Figures & data
Figure 1. Exposure to Gen induces apoptosis in a time-dependent and dose-dependent manner. LLC-PK1 cells were incubated with Gen at different concentrations for 12, 24, 36, or 72 h. Cell viability was determined by the MTT assay (A), and morphology was examined by phase contrast microscopy at ×100 magnification (B). The values are mean ± SD (n = 3).
Notes: *p < 0.05 versus control. **p < 0.01 versus control.
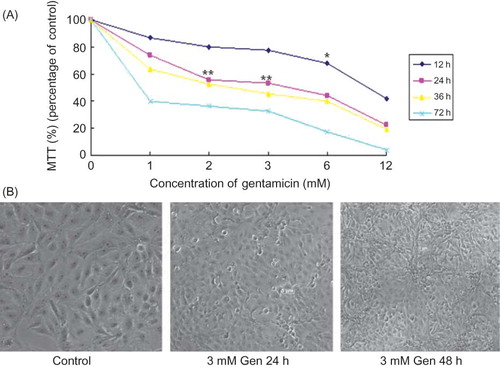
Figure 2. Exposure to Gen induces PARP cleavage and apoptosis. PARP cleavage was examined by Western blotting (A) and apoptosis rate by FACS (B) in cells treated with 3 mM Gen for 24 h. The values are mean ± SD (n = 5).
Note: *p < 0.01 versus control.
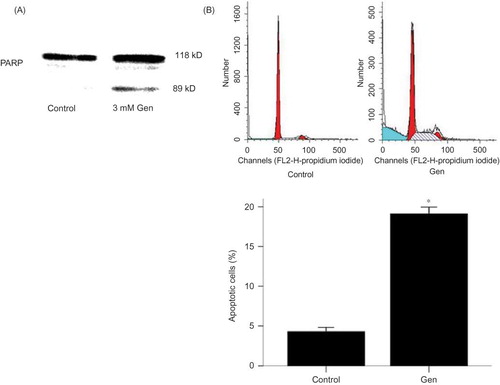
Figure 3. Exposure to Gen induces activations of iNOS, p38 MAPK, NF-κB, and Bax, as well as inhibition of Bcl-2. Alteration in iNOS (A), phospho-p38 MAPK (B), NF-κB (C), Bcl-2 (D), and Bax (E) after exposure to Gen for 24 h was detected by Western blotting. The values are mean ± SD (n = 3).
Note: *p < 0.01 versus Gen treatment.
Figure 4. Protection against Gen-induced apoptosis by iNOS inhibitor AG, p38 inhibitor SB203580, and NACA. (A) Phase contrast microscopy at ×100 magnification. (B) PARP cleavage by Western blotting. (C) Apoptosis rate by FACS. The values are mean ± SD (n = 5).
Notes: **p < 0.01 versus Gen treatment. #p < 0.05 versus control. ##p < 0.01 versus control.
Figure 5. Effects of AG, SB203580, and NACA on iNOS (A). Protein expression and effects of NACA and SB203580 on phosphor-p38 MAPK protein expression (B). The values are mean ± SD (n = 3).
Notes: *p < 0.05 versus Gen treatment. **p < 0.01 versus Gen treatment. #p < 0.05 versus control. ##p < 0.01 versus control.
Figure 6. Effects of AG and NACA on NF-κB and Bcl-2 protein expression. The values are mean ± SD (n = 3).
Notes: **p < 0.01 versus Gen treatment. #p < 0.05 versus control. ##p < 0.01 versus control.
Figure 7. Effects of AG and NACA on Bax protein expression (A) and the effect of SB203580 on NF-κB protein expression (B). The values are mean ± SD (n = 3).
Notes: **p < 0.01 versus Gen treatment. ##p < 0.01 versus control.
Figure 8. Effects of SB203580 on Bcl-2 and Bax protein expression. The values are mean ± SD (n = 3).
Notes: **p < 0.01 versus Gen treatment. #p < 0.05 versus control. ##p < 0.01 versus control.