Figures & data
Figure 1. (A) The hippocampus (1) and hypothalamus (2) are identified on the coronal section of rat brain (DAB coloration) according to the Rat Brain Structure by Larry Swanson. The ghrelin protein expression (B) and the GHSR protein expression (C) in the hippocampus and hypothalamus of both groups are showed with a 400-fold magnification. The gray mean ± SD of ghrelin (D) and GHSR (E) in the two regions demonstrate the between-group differences in protein expression (n = 16 per subgroup, including eight controls and eight CRF rats). The OD mean ± SD of ghrelin (F) and GHSR (G) show the difference in mRNA expression between the two groups (n = 16 per subgroup, including eight controls and eight CRF rats).Note: *p < 0.05 and **p < 0.01.
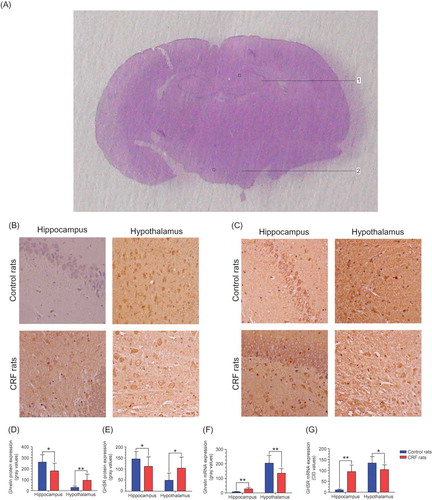
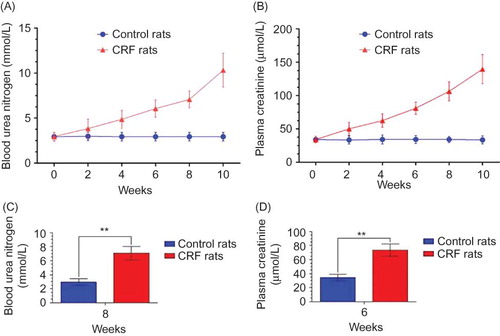
Figure 2. The BUN (A) and PCr (B) of both groups (n = 10 per group) are documented every 2 weeks for observing their dynamic changes to determine when to start the detection of ghrelin and GHSR expression. The BUN value (C) of CRF rats in the 8th week and the PCr value (D) in the 6th week were more than double the normal value. By the 10th week, the two values were maintained at a higher level for or over 2 weeks, indicating that we could start the next experiment.Note: **p < 0.01.