665
Views
15
CrossRef citations to date
0
Altmetric
Clinical Study

Plasma Indoleamine 2,3-Dioxygenase and Arginase Type I May Contribute to Decreased Blood T-Cell Count in Hemodialysis Patients

, , , , , & show all
Pages 1118-1122 | Received 08 May 2012, Accepted 06 Jul 2012, Published online: 17 Aug 2012

Figures & data

Table 1. Patients’ clinical characteristics.

Figure 1. Plasma IDO concentration in HD patients and healthy volunteers.

Note: Plasma IDO concentration was significantly higher in HD patients than in healthy volunteers (44.30 ± 31.83 ng/mL vs. 21.28 ± 26.21 ng/mL, p = 0.009, 95% CI of difference from 5.96 to 40.10 ng/mL).
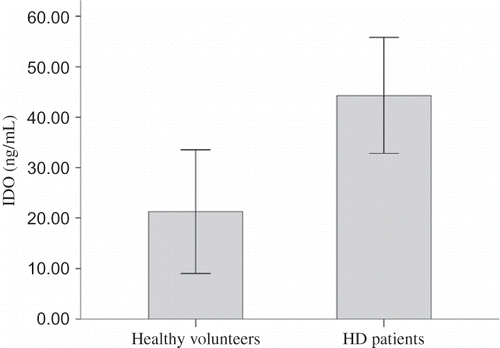
Figure 1. Plasma IDO concentration in HD patients and healthy volunteers.Note: Plasma IDO concentration was significantly higher in HD patients than in healthy volunteers (44.30 ± 31.83 ng/mL vs. 21.28 ± 26.21 ng/mL, p = 0.009, 95% CI of difference from 5.96 to 40.10 ng/mL).

Figure 2. Plasma ARG concentration in HD patients and healthy volunteers.

Note: There was a trend for higher plasma ARG concentration in HD patients (13.43 ± 11.91 ng/mL) than in healthy volunteers (9.56 ± 4.03 ng/mL), which however did not reach statistical significance (p = 0.099, 95% CI of difference from −0.75 to 8.49 ng/mL).
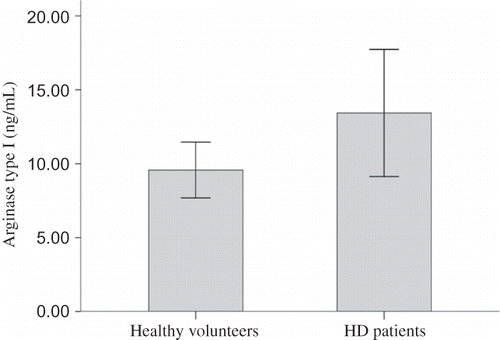
Figure 2. Plasma ARG concentration in HD patients and healthy volunteers.Note: There was a trend for higher plasma ARG concentration in HD patients (13.43 ± 11.91 ng/mL) than in healthy volunteers (9.56 ± 4.03 ng/mL), which however did not reach statistical significance (p = 0.099, 95% CI of difference from −0.75 to 8.49 ng/mL).

Figure 3. Absolute blood T-cell number in HD patients and healthy volunteers.

Note: Absolute T-cell count was significantly lower in HD patients than in healthy volunteers (1176.99 ± 567.71 cells/mm3 vs. 1519.85 ± 594.96 cells/mm3, p = 0.040, 95% CI of difference from −669.60 to −16.12 cells/mm3).
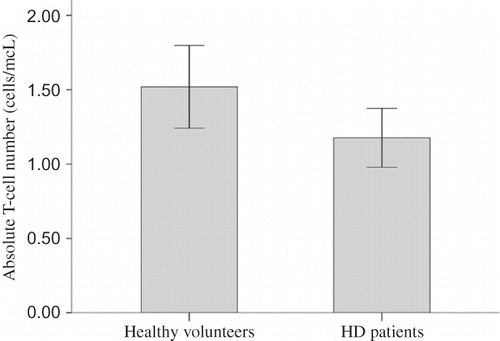
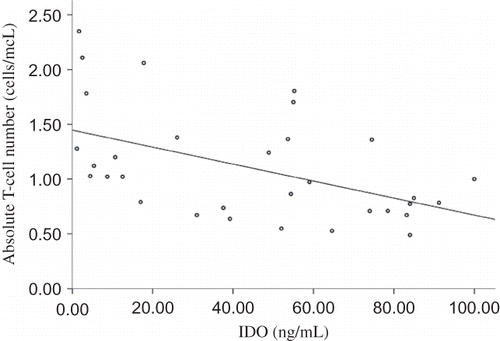
Figure 3. Absolute blood T-cell number in HD patients and healthy volunteers.Note: Absolute T-cell count was significantly lower in HD patients than in healthy volunteers (1176.99 ± 567.71 cells/mm3 vs. 1519.85 ± 594.96 cells/mm3, p = 0.040, 95% CI of difference from −669.60 to −16.12 cells/mm3).
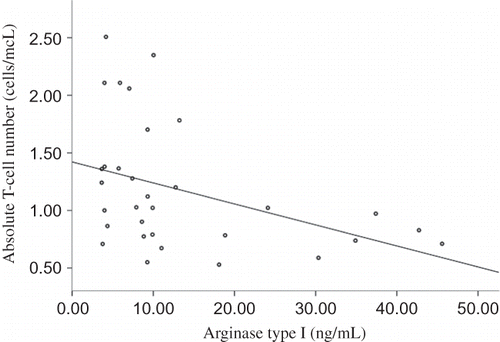
Figure 4. Relation between absolute blood T-cell number and plasma IDO in HD patients.

Note: Absolute blood T-cell number was inversely related to plasma IDO concentration in HD patients (r = −0.490, p = 0.004).

Figure 4. Relation between absolute blood T-cell number and plasma IDO in HD patients.Note: Absolute blood T-cell number was inversely related to plasma IDO concentration in HD patients (r = −0.490, p = 0.004).

Figure 5. Relation between absolute blood T-cell number and plasma ARG in HD patients.

Note: Absolute blood T-cell count was inversely related to plasma ARG concentration in HD patients (r = −0.387, p = 0.029).

Figure 5. Relation between absolute blood T-cell number and plasma ARG in HD patients.Note: Absolute blood T-cell count was inversely related to plasma ARG concentration in HD patients (r = −0.387, p = 0.029).

Reprints and Corporate Permissions

Please note: Selecting permissions does not provide access to the full text of the article, please see our help page How do I view content?

To request a reprint or corporate permissions for this article, please click on the relevant link below:

Academic Permissions

Please note: Selecting permissions does not provide access to the full text of the article, please see our help page How do I view content?

Obtain permissions instantly via Rightslink by clicking on the button below:

If you are unable to obtain permissions via Rightslink, please complete and submit this Permissions form. For more information, please visit our Permissions help page.