Figures & data
Figure 1. Survival rates after ischemic renal injury. (A) Rats exposed to 75/90-min ischemia sustained the most losses (38.46% vs. 20.51% survival, at 1 week and 4 weeks, respectively), whereas rats exposed to the 60/60-min ischemia protocol sustained the least (82.5% vs. 47.5% survival, at 1 week and 4 weeks, respectively). The survival rates in the other three groups fell in between these values. The bilateral 60-min group demonstrated a significantly better survival rate compared to the 75/90-, 75/75-, and 60/75-min groups (*p < 0.05). There was also a difference between the 60/90- and 75/90-min groups (*p < 0.05).
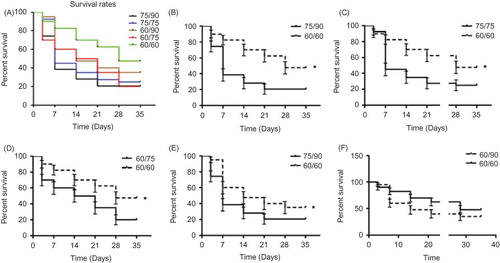
Figure 2. Effect of ischemia/reperfusion (I/R) injury on renal function. Renal function pre- (0 h) and post-ischemia and reperfusion were evaluated through measurement of serum creatinine (SCr) concentration. (A) Average SCr level rose during the first week after injury and then recovered after 2 weeks. (B) SCr in all groups on the third day after I/R was higher than the normal control (*p < 0.001,), and there were some differences between the groups (#p < 0.01). (C) After a peak in the first week, a few groups still had impaired renal function at 2, 3, and 4 weeks (*p < 0.01 vs. control at 2, 3 week and p < 0.05 at 4 week). (D) Percentage of the animals with renal insufficiency (Scr > 1.1).
Figure 3. (A) Representative example of renal histology at different time points after ischemic injury. The renal tubules showed an increase in lumen diameter, sloughing off of cells into the lumen, and overall architectural disjointedness at 2 weeks. Starting in the fourth week and continuing through the 6th week, inflammatory cells occupied the whole kidney. At 12 weeks post-injury, the structure of the tubules returned to normal but some glomerular sclerosis was still present throughout the tissue. Sections were stained with hematoxylin and eosin (400×). (B) Tubular injury increased significantly after the first week in all three ischemia groups. The 75- and 90-min ischemic kidneys had significantly more evidence of injury at 1, 2, and 6 weeks compared to the 60-min ischemic kidneys. (C) The 75- and 90-min ischemic kidneys had fewer glomeruli than 60-min ischemic kidneys at the 2 week time point (p < 0.01). There was no difference in each ischemia group or between the time points after 1 week.
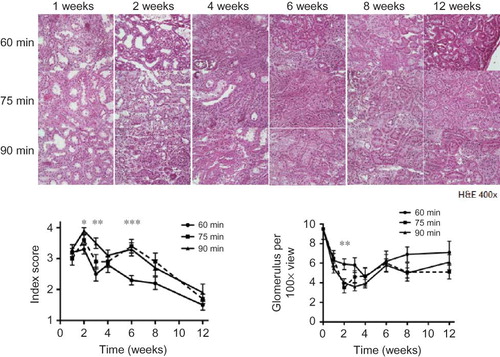
Figure 4. (A) At 1 week, the 90-min group had fewer PCNA positive cells than the other groups (p < 0.05). (B–D) Cell death increased throughout the entire experiment in all three ischemic groups compared to the age-matched control (p < 0.001, data not shown). In all three groups, the number of apoptotic cells increased steadily during the 6 weeks post-surgery, and then leveled off beginning at 8 weeks. While there was a significant difference between time points within each group (p < 0.001), there was no difference between 60-, 75-, and 90-min ischemic kidneys at each time point.
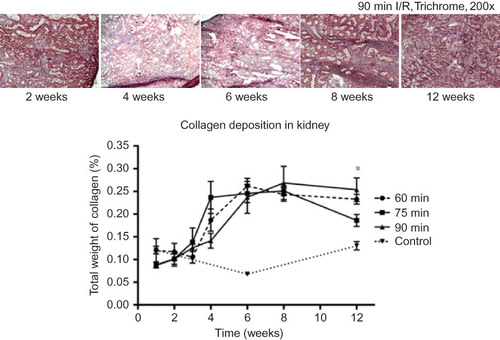
Figure 5. Compared to the control kidneys, all three ischemic groups demonstrated increases in collagen deposition during the 4th week, and continued to rise sharply until 6 weeks. There was, no significant difference between the groups, except at the 12 week time point, in which the 90-min ischemic kidneys appeared to have more collagen deposition than the 75-min kidneys (*p < 0.05).