Figures & data
Figure 1. Enrollment scheme and patient status. CKD, chronic kidney disease; eGFR, estimated glomerular filtration rate.
Figure 2. The effect of MDC duration on the rate of renal progression in stage 5 CKD patients.
The horizontal dotted line corresponds to the level of kidney function at the initiation of dialysis (eGFR = 5 mL/min/1.73 m2). The declines in kidney function are illustrated as diagonal lines.
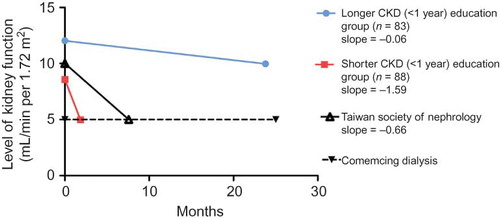
Figure 3. Delivery of annual medical cost savings.
Per capita medical cost savings resulting from longer (>1 year) MDC was estimated for the cases with delayed onset of hemodialysis.
Annual cost savings = delay time (months) × hemodialysis sessions per month × reimbursement ÷ 12 = [(83.33 − 7.57) × 13 × 4100 ÷ 12] = NTD 336,500.66 compared with the cost of care incurred by the Taiwan Society of Nephrology (1 USD = 29.7 NTD).
![Figure 3. Delivery of annual medical cost savings.Per capita medical cost savings resulting from longer (>1 year) MDC was estimated for the cases with delayed onset of hemodialysis.Annual cost savings = delay time (months) × hemodialysis sessions per month × reimbursement ÷ 12 = [(83.33 − 7.57) × 13 × 4100 ÷ 12] = NTD 336,500.66 compared with the cost of care incurred by the Taiwan Society of Nephrology (1 USD = 29.7 NTD).](/cms/asset/5a993d68-304f-4db9-a953-122a468436e9/irnf_a_731997_f0003_b.jpg)
Figure 4. The effect of MDC on the rate of renal progression in stage 5 CKD patients with or without DM.The diabetic group had a steeper rate of decline in mean eGFR and a shorter follow-up period than the nondiabetic group.
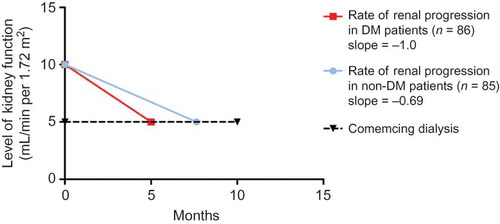
Table 1. Summary of demographics at incidental dialysis initiation in CKD noneducational intervention and CKD educational intervention groups.
Table 2. Unadjusted and adjusted OR and 95% CI of high medical costsFootnotea associated with stage 5 CKD patients without the MDC program.
Table 3. The effect of MDC duration on the laboratory data and the rate of renal disease progression in stage 5 CKD patients between 1 January 2005 and 31 May 2008.
Table 4. The effect of MDC on the rate of renal progression in stage 5 CKD patients with DM and without DM between 1 January 2005 and 31 May 2008.