Figures & data
Table 1. Experimental protocol for urolithiasis and treatment groups.
Table 2. The levels of Ca, P, and Mg in the serum of experimental groups.
Table 3. The levels of Ca, P, and Mg in the urine of experimental groups.
Figure 1. Urine CaOx levels in urolithiasis rats treated with amlodipine.
Notes: Each value is mean ± SD for 6 rats in each group. Statistical analysis was carried out using one-way ANOVA followed by LSD test. Intact control, intact amlodipine, and amlodipine plus urolithiasis groups were compared with the urolithiasis group.*Significant at p < 0.05.
Figure 2. Percentage changes in body weight of the rat groups over 21 days of the experiment.
Notes: Each value is mean for 6 rats in each group. Statistical analysis for the third weekend weight was carried out using one-way ANOVA followed by LSD. Intact control, intact amlodipine, and urolithiasis plus amlodipine groups were compared with the urolithiasis group.*Significant at p < 0.05.
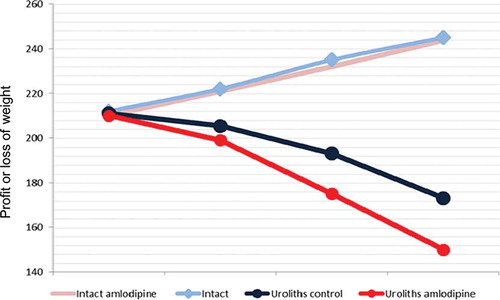
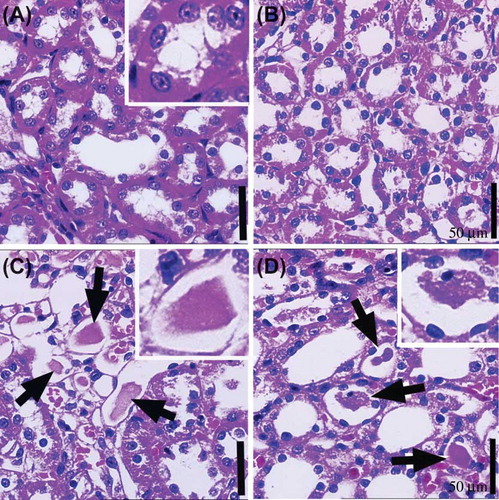
Figure 3. The medullary area of kidney tissue in (A) the intact control group, (B) intact amlodipine group, (C) urolithiasis group, and (D) amlodipine plus urolithiasis group.
Note: Crystal deposits (white arrow and square area) are observed in the intratubular area and degenerative tubular structures in the medullary area of the (C) urolithiasis model group and (D) amlodipine plus urolithiasis group.Scale bar: 50 μm.