Figures & data
Table 1. Clinical background of all patients (mean ± SD).
Table 2. Comparison of patients reaching the primary end point.Footnotea
Table 3. Logistic regression analysis of outcome.
Table 4. Multivariate analysis of factors associated with survival in 64 patients using a Cox proportional hazards regression model.
Figure 1. Survival and serum creatinine in the entire group. Scr > 459.73 umol/L at presentation was associated with a significantly poor prognosis.
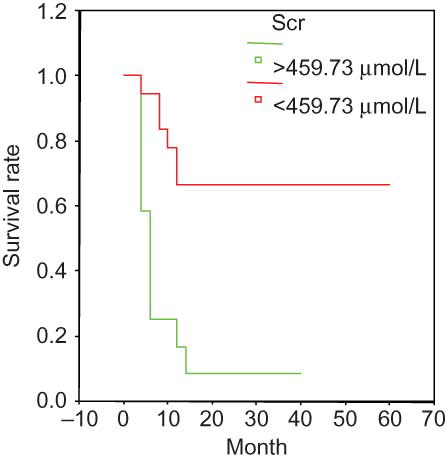
Figure 2. Survival and ESR in the entire group. ESR > 99.12 mm/h at presentation was associated with a significantly poor prognosis.
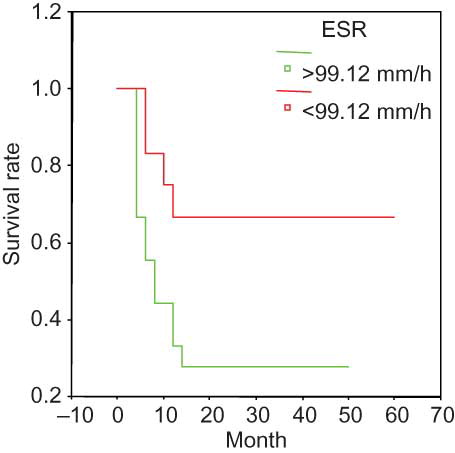
Figure 3. Survival and serum albumin in the entire group. sALB < 30.04 g/dL at presentation was associated with a significantly poor prognosis.
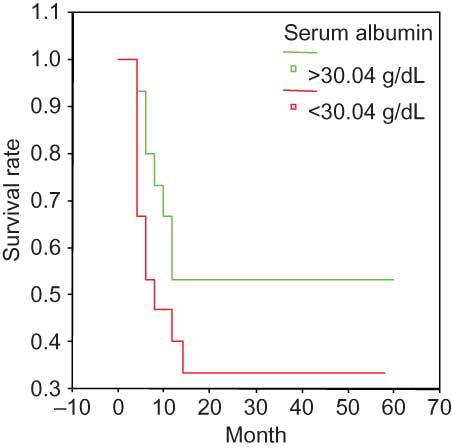
Figure 4. Survival and hemoglobin in the entire group. Hb < 84.06 g/dL at presentation was associated with a significantly poor prognosis.
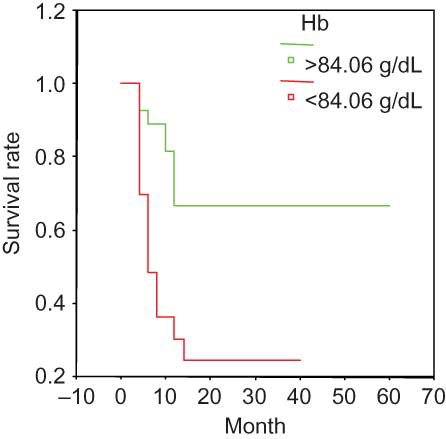
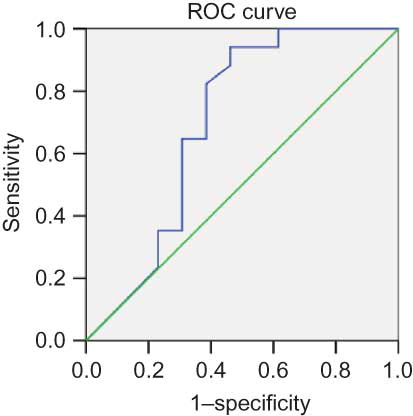
Figure 5. Diagnostic performance of serum creatinine for the identification of survival. Area under the curve (AUC) was 0.94 using a cutoff of 395.05 μmol/L; sensitivity was 94.1% and specificity was 92.3%.
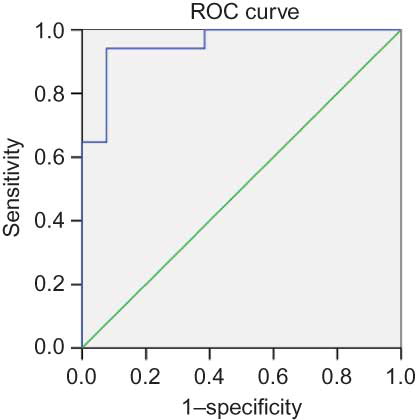
Figure 6. Diagnostic performance ESR for the identification of survival. Area under the curve (AUC) was 0.8 using a cutoff 73 mm/h; sensitivity was 94% and specificity was 70%. Diagonal segments are produced by ties.