754
Views
5
CrossRef citations to date
0
Altmetric
Laboratory Study

Protective Effect of SnCl2 on K2Cr2O7-Induced Toxicity in LLC-PK1 Cells

, , , , &
Pages 132-137 | Received 29 Jun 2012, Accepted 27 Sep 2012, Published online: 01 Nov 2012

Figures & data

Figure 1.  Effect of stannous chloride (SnCl2) on potassium dichromate (K2Cr2O7)-induced toxicity and on HO activity in LLC-PK1 cells. K2Cr2O7 (30 μM), SnCl2 (200 μM), and stannous protoporphyrin (SnPP, 40 μM) were added for 24 h as indicated above. At the end of this period, viability or HO activity were measured. Data are expressed as mean ± SE, n = 9. ap < 0.001 versus control, bp < 0.001 versus K2Cr2O7, cp < 0.001 versus K2Cr2O7 + SnCl2.
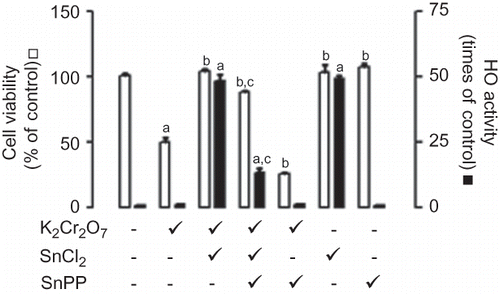
Figure 1.  Effect of stannous chloride (SnCl2) on potassium dichromate (K2Cr2O7)-induced toxicity and on HO activity in LLC-PK1 cells. K2Cr2O7 (30 μM), SnCl2 (200 μM), and stannous protoporphyrin (SnPP, 40 μM) were added for 24 h as indicated above. At the end of this period, viability or HO activity were measured. Data are expressed as mean ± SE, n = 9. ap < 0.001 versus control, bp < 0.001 versus K2Cr2O7, cp < 0.001 versus K2Cr2O7 + SnCl2.

Figure 2.  Effect of stannous chloride (SnCl2) on potassium dichromate (K2Cr2O7)-induced toxicity on LLC-PK1 cells. The cells were incubated without or with treatment for 24 h at the end of which light microscopy micrographs were taken (200×). (A) Control cells; (B) K2Cr2O7 (30 μM)-treated cells; (C) SnCl2 (200 μM)-treated cells; (D) K2Cr2O7- and SnCl2-treated cells.
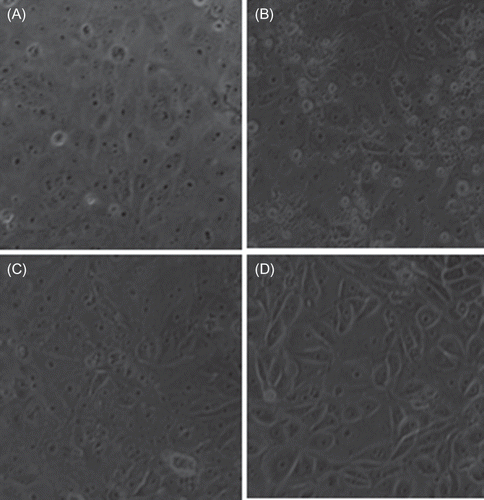
Figure 2.  Effect of stannous chloride (SnCl2) on potassium dichromate (K2Cr2O7)-induced toxicity on LLC-PK1 cells. The cells were incubated without or with treatment for 24 h at the end of which light microscopy micrographs were taken (200×). (A) Control cells; (B) K2Cr2O7 (30 μM)-treated cells; (C) SnCl2 (200 μM)-treated cells; (D) K2Cr2O7- and SnCl2-treated cells.

Figure 3.  Comparative effect of stannous chloride (SnCl2, 200 μM), N-acetyl cysteine (NAC, 10 μM), and glutathione (GSH, 20 μM) on potassium dichromate (K2Cr2O7, 30 μM) induced changes on (A) cell viability, (A) peroxynitrite production, (A) reduced thiol content, (A) intracellular content of Cr(VI), (B) extracellular concentration of Cr(VI) in culture medium and (B) concentration of Cr(VI) in culture medium not exposed to cells. Data are expressed as mean ± SE, n = 9. ap < 0.001 versus control, bp < 0.001 versus K2Cr2O7.
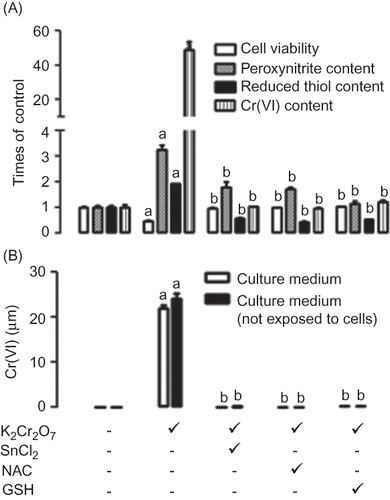
Figure 3.  Comparative effect of stannous chloride (SnCl2, 200 μM), N-acetyl cysteine (NAC, 10 μM), and glutathione (GSH, 20 μM) on potassium dichromate (K2Cr2O7, 30 μM) induced changes on (A) cell viability, (A) peroxynitrite production, (A) reduced thiol content, (A) intracellular content of Cr(VI), (B) extracellular concentration of Cr(VI) in culture medium and (B) concentration of Cr(VI) in culture medium not exposed to cells. Data are expressed as mean ± SE, n = 9. ap < 0.001 versus control, bp < 0.001 versus K2Cr2O7.
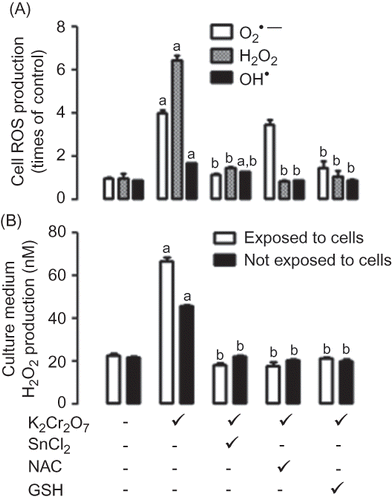
Figure 4.  Comparative effect of stannous chloride (SnCl2, 200 μM), N-acetyl cysteine (NAC, 10 μM), and glutathione (GSH, 20 μM) on potassium dichromate (K2Cr2O7, 30 μM) induced changes on (A) superoxide (O2•−) production, (A) hydrogen peroxide (H2O2) production, (A) hydroxyl radical (OH) production, (B) extracellular hydrogen peroxide (H2O2) production, and (B) hydrogen peroxide (H2O2) production in culture medium not exposed to cells. Data are expressed as mean ± SE, n = 9. ap < 0.001 versus control, bp < 0.001 versus K2Cr2O7.
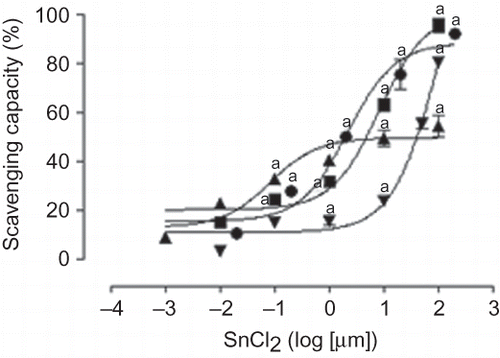
Figure 4.  Comparative effect of stannous chloride (SnCl2, 200 μM), N-acetyl cysteine (NAC, 10 μM), and glutathione (GSH, 20 μM) on potassium dichromate (K2Cr2O7, 30 μM) induced changes on (A) superoxide (O2•−) production, (A) hydrogen peroxide (H2O2) production, (A) hydroxyl radical (OH•) production, (B) extracellular hydrogen peroxide (H2O2) production, and (B) hydrogen peroxide (H2O2) production in culture medium not exposed to cells. Data are expressed as mean ± SE, n = 9. ap < 0.001 versus control, bp < 0.001 versus K2Cr2O7.

Figure 5.  Scavenging activity of SnCl2. •, superoxide; ▪, hydrogen peroxide; ▴, hydroxyl; ▾, peroxynitrite. Data are expressed as mean ± SE, n = 9. ap < 0.001 versus 0.

Figure 5.  Scavenging activity of SnCl2. •, superoxide; ▪, hydrogen peroxide; ▴, hydroxyl; ▾, peroxynitrite. Data are expressed as mean ± SE, n = 9. ap < 0.001 versus 0.

Reprints and Corporate Permissions

Please note: Selecting permissions does not provide access to the full text of the article, please see our help page How do I view content?

To request a reprint or corporate permissions for this article, please click on the relevant link below:

Academic Permissions

Please note: Selecting permissions does not provide access to the full text of the article, please see our help page How do I view content?

Obtain permissions instantly via Rightslink by clicking on the button below:

If you are unable to obtain permissions via Rightslink, please complete and submit this Permissions form. For more information, please visit our Permissions help page.