Figures & data
Figure 1. Timeline of the study. SBP was measured at Week −2 (baseline), Weeks 1, 3, 5, and 7. Renal arterial branch ligation or the first stage of the operation was performed at Week −1. Right nephrectomy or the second stage of the operation was performed at Week 0. The rats were followed for a total of 7 weeks post-nephrectomy. Urine and blood samples were collected at Weeks 0, 1, 3, 5, and 7. All rats were sacrificed at Week 7. Kidney sections were stained for histological examination.
Figure 2. Hibiscus sabdariffa Linn. (HS) attenuated the progression of chronic kidney disease. The progression of the renal injury is shown according to the following measurements: (A) blood urea nitrogen (BUN), (B) serum creatinine (Scr), (C) creatinine clearance (CCr), and (D) 24 h urine protein in HS-treated 5/6 Nx rats (Nx+HS: n = 8), placebo-treated 5/6 Nx rats (Nx: n = 8), and sham control rats (sham: n = 4). Notes: * Indicates that the p < 0.01 is between the Nx-HS or Nx group and the sham group. ** Indicates that the p < 0.05 is between the Nx-HS or Nx group and the sham group. # Indicates that the p < 0.05 is between the Nx-HS and the Nx group.
Figure 3. The severity of the chronic kidney disease from renal histology was attenuated by Hibiscus sabdariffa Linn. (HS). The renal histology results are representative of four to eight rats per group. Results from the Periodic Acid-Shiff (PAS) staining of the glomerulus (left panel) and tubulointerstitium (right panel) for the sham control group (sham control rats: A, B), Nx group (placebo-treated 5/6 Nx rats: C, D), and Nx+HS group (HS-treated 5/6 Nx rats: E, F). Magnification of the glomeruli was done at 400X and the interstitial area at 200X. The analysis of the glomerular injury (G) and the tubulointerstitial injury (H) are shown for sham control rats (sham: n = 4), placebo-treated 5/6 Nx rats (Nx: n = 8), and HS-treated 5/6 Nx rats (Nx+HS: n = 8). Note: * indicates p < 0.05.
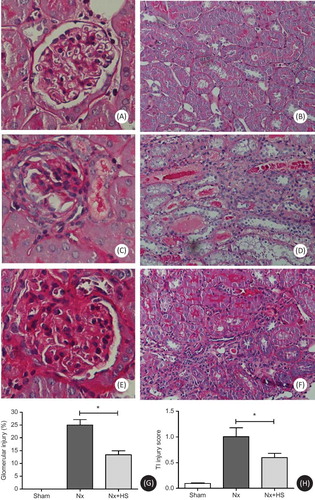
Figure 4. Tubulointerstitial fibrosis in chronic kidney disease is attenuated by Hibiscus sabdariffa Linn. (HS). The renal histology results are representative of four to eight rats per group. Results from the Masson’s trichrome staining for the sham control group (sham control rats: A), Nx group (placebo-treated 5/6 Nx rats: B), and Nx+HS group (HS-treated 5/6 Nx rats: C) at Week 7. Magnification was done at 200X. The quantitative measurement of the tubulointerstitial fibrotic area by image J program (D) are shown for the sham control group (sham: n = 4), placebo-treated 5/6 Nx (Nx: n = 8), and HS-treated 5/6 Nx rats (Nx+HS: n = 8) at 7 weeks after 5/6 Nx.Note: * indicates p < 0.05.
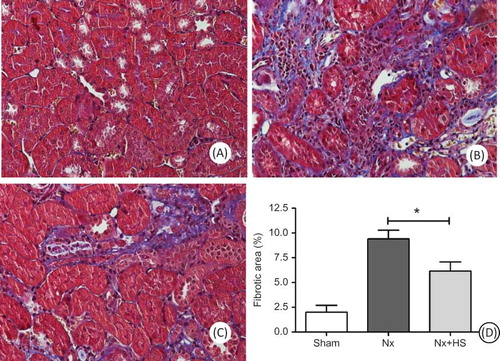
Figure 5. Hypertension in chronic kidney disease is attenuated by Hibiscus sabdariffa Linn. (HS). Systolic blood pressure measurements are plotted at multiple time points after 5/6 Nx for the sham control rats (sham: n = 4), placebo-treated 5/6 Nx rats (Nx: n = 8), and HS-treated 5/6 Nx rats (Nx+HS: n = 8).Notes: * Indicates that the p < 0.05 is between the Nx+HS group and the sham group. # Indicates that the p < 0.01 is between the Nx+HS group and the Nx group.
Figure 6. The effects of Hibiscus sabdariffa Linn. (HS) in lowering levels of malondialdehyde (MDA) in chronic kidney disease. Serum levels of malondialdehyde (MDA) are plotted at multiple time points for the sham control rats (sham: n = 4), placebo-treated 5/6 Nx rats (Nx: n = 8), and HS-treated 5/6 Nx rats (Nx+HS: n = 8).Notes: * Indicates that the p < 0.05 is between the Nx+HS group and the sham group. # Indicates that the p < 0.01 is between the Nx+HS group and the Nx group. ## Indicate that the p < 0.05 is between the Nx+HS group and the Nx group.
Figure 7. Hibiscus sabdariffa Linn. (HS) had no effect on the serum levels of TNF-α and IL-6 in chronic kidney disease. The serum levels of TNF-α (A) and IL-6 (B) are shown for the sham control rats (sham: n = 4), placebo-treated 5/6 Nx rats (Nx: n = 8), and HS-treated 5/6 Nx rats (Nx+HS: n = 8) at 7 weeks after 5/6 Nx.Note: * indicates p < 0.05.