Figures & data
Figure 1. Sections of renal tissue were stained with H&E at 24 h after reperfusion. Rats with NGAL displayed an attenuated histopathologic response compared to I/R + NS rat. (A) Control group, (B) I/R + NGAL group, (C) I/R + NS group. Original magnification, ×400. Scale bars: 20 μm.
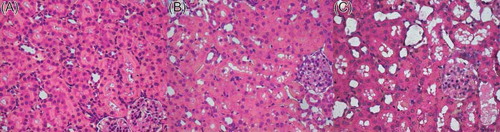
Table 1. Serum creatinine and blood urea nitrogen (mean ± SD; n = 6).
Figure 2. Photomicrographs of TUNEL-stained kidney sections of rat. Control group (A) displayed a minimal incidence of apoptosis. TUNEL staining showed dramatically fewer apoptotic nuclei in NGAL-treated rat (B) compared to the I/R + NS group (C). Original magnification, ×400. Scale bars: 20 μm. The number of TUNEL-positive cells was for 10 images/slide and expresses as positive cells per high power field (HPF).Note: *p < 0.05 versus control group, #p < 0.05 versus I/R + NS group. Data are mean ± standard deviation (SD) for n = 6 animals per group.
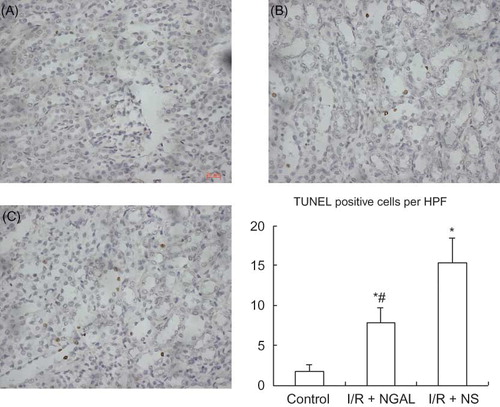
Figure 3. Immunohistochemical staining of Cleaved caspase-3 and Bax in kidney tissue at 24 h after reperfusion. (A–C) Cleaved caspase-3 located mainly in nucleus of renal tubular epithelial cells. (D–F) Bax existed mainly in cytoplasm of renal tubular epithelial cells. (A) and (D); Control group, (B) and (E); I/R + NGAL group, (C) and (F); I/R + NS group. Original magnification, ×400. Scale bars: 20 μm.
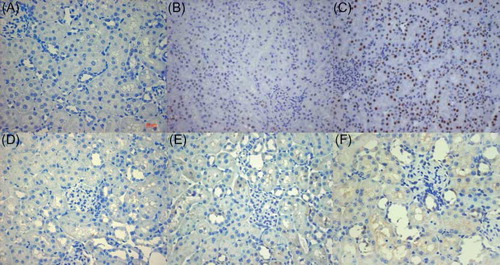
Figure 4. Western blot analysis of Cleaved caspase-3 and Bax in renal tubular epithelial cells. Representative immunoblots of Cleaved caspase-3 (A) and Bax (B). Densitometric quantification of Cleaved caspase-3 (C) and Bax (D). Note: *p < 0.05 versus control group, #p < 0.05 versus I/R + NS group. Data are mean ± standard deviation (SD) for n = 6 animals per group.
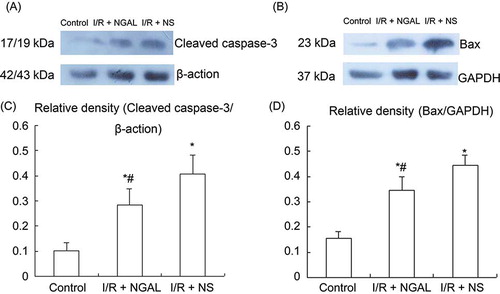
Figure 5. The mRNA expression of Bax gene in kidney of rat. Quantification of Bax mRNA normalized to GAPDH. NGAL-treated rat reduced the level of Bax mRNA compared to the I/R + NS group. Note: *p < 0.05 versus the control group, #p < 0.05 versus I/R + NS group. Data are mean ± standard deviation (SD) for n = 6 animals per group.
Table 2. Positive rations of Cleaved caspase-3 and Bax (mean ± SD; n = 12).