Figures & data
Table 1. Comparison of study groups regarding functional alternations.
Table 2. Comparison of study groups regarding morphologic alterations.
Figure 1. Transforming growth factor-β1 (TGF-β1) level in study groups. Note: CG, chlorhexidine gluconate.
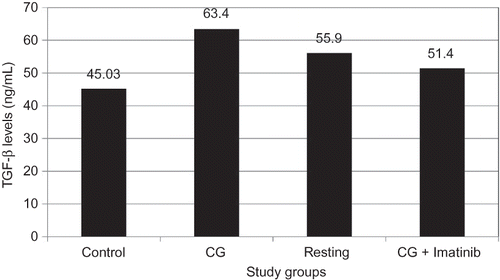
Figure 2. Histologic features of the parietal peritoneum (hematoxylin-eosin, magnification ×200). (A) The intact thin mesothelial layer of the peritoneum overlies muscle in the control group. (B) Chlorhexidine significantly increased thickness, cellularity (inflammation), and fibrotic changes. (C) Peritoneal rest had no morphologic benefits; increased vascularity, thickness, and fibrosis are also shown in the resting group. (D) Imatinib treatment group is characterized by reduced cellularity (inflammation).
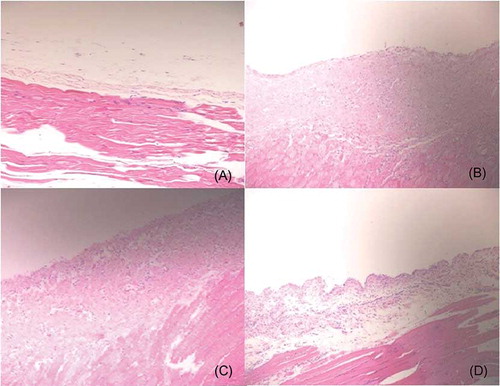
Figure 3. Transforming growth factor-β1 (TGF-β1) positive cell count in study groups. CG, chlorhexidine gluconate..
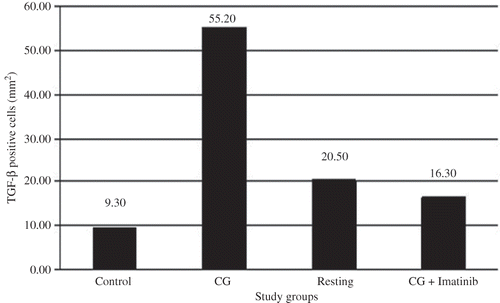
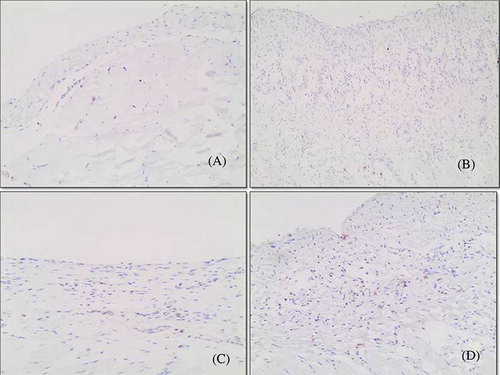
Figure 4. Immunohistochemical staining for transforming growth factor-β1 (TGF-β1). Histologic sections from (A) the control group, (B) CG group, (C) resting group, and (D) CG + IMA group (magnification ×200).